
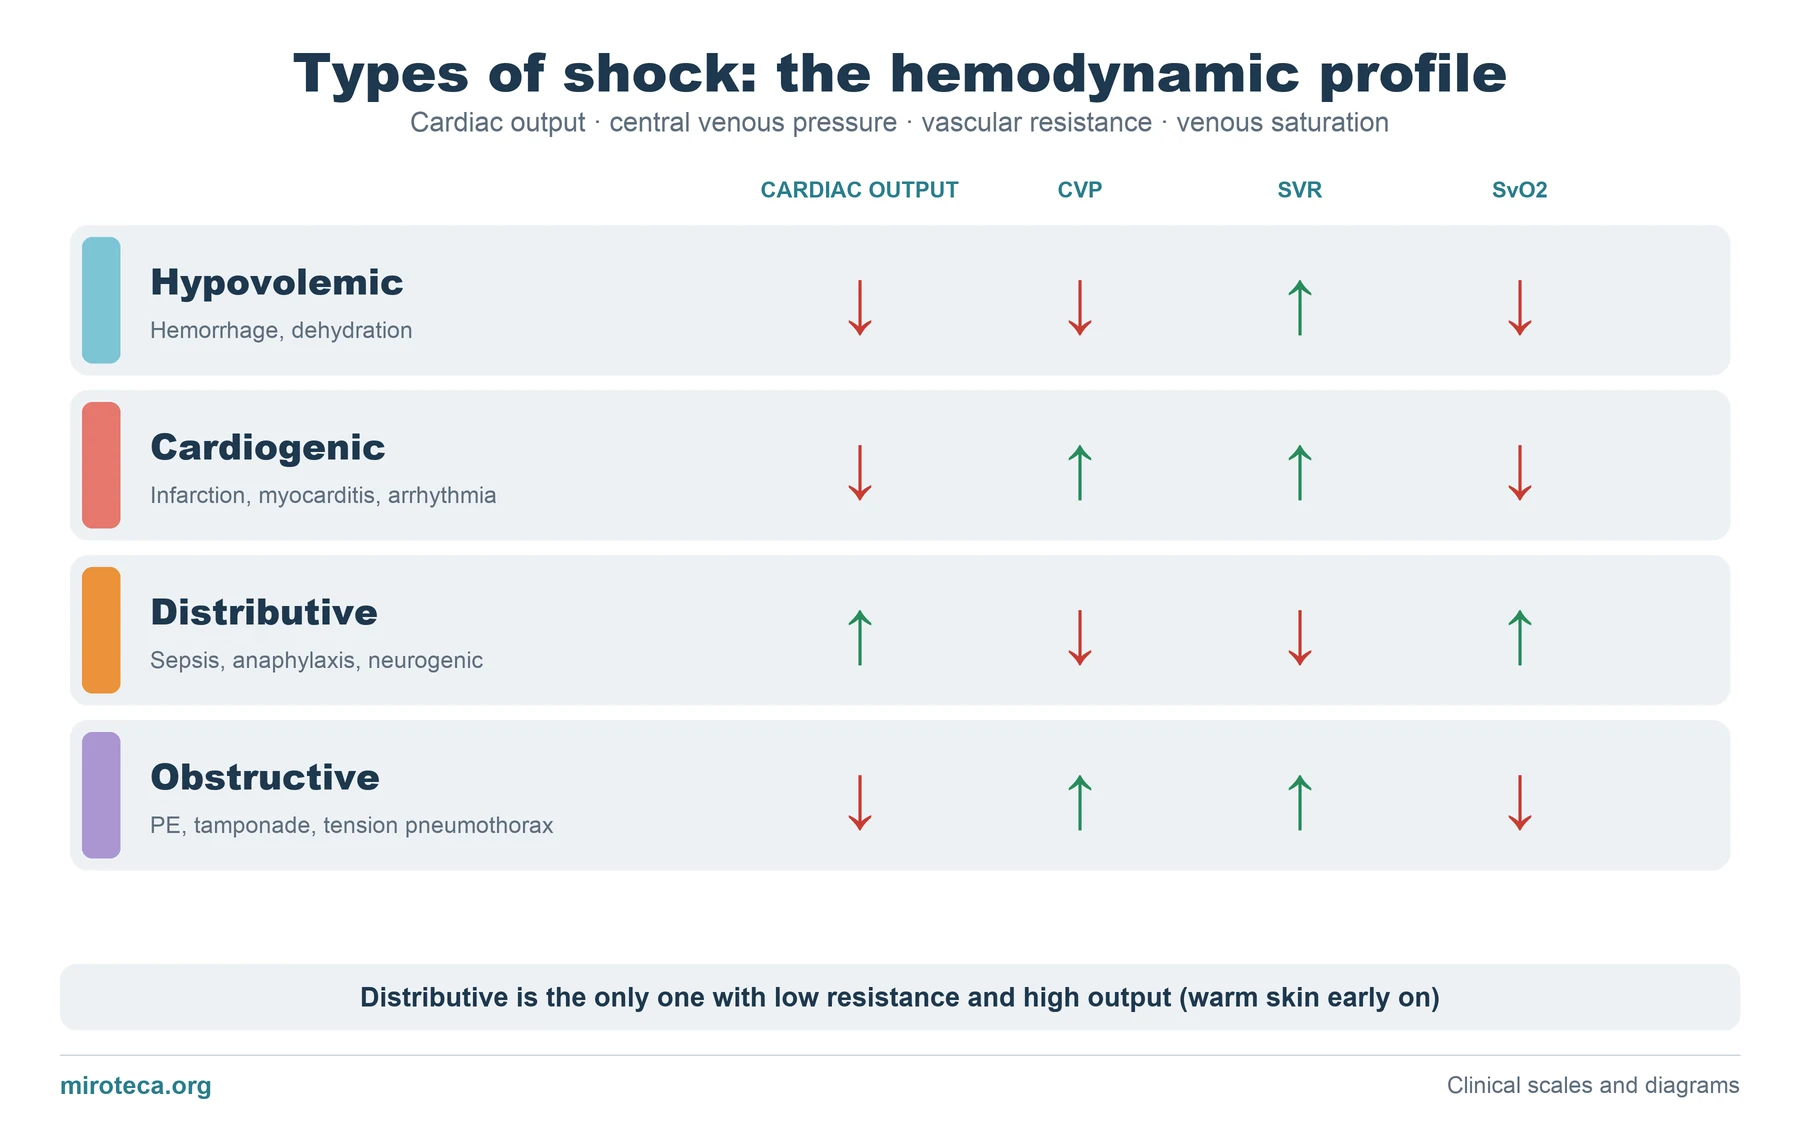
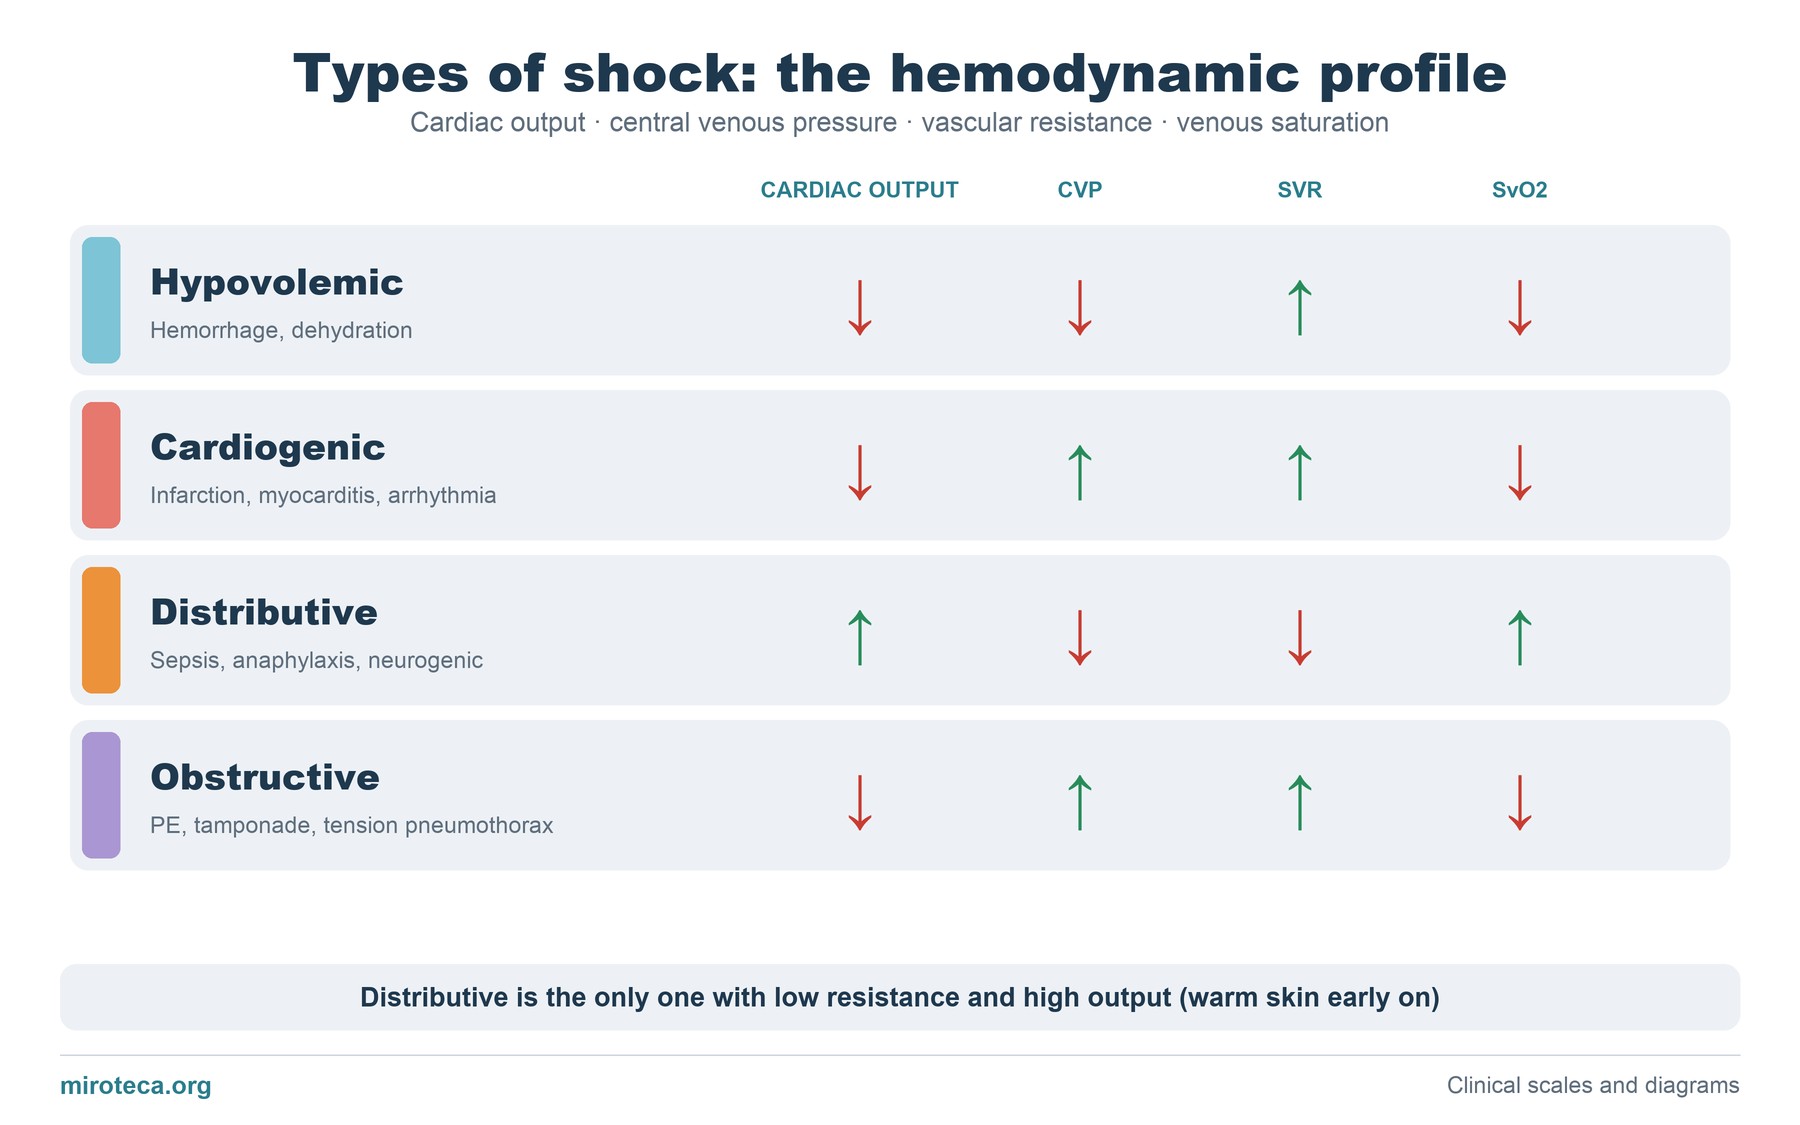
What the diagram shows
Four rows, one per type of shock, and four columns with the variables that tell them apart: cardiac output, central venous pressure (CVP), systemic vascular resistance (SVR) and venous oxygen saturation (SvO2). Green arrows go up and red arrows go down.
These are the typical profiles, in the early phase and before treatment; in practice they can overlap.
The detail that settles it
Distributive shock (septic shock is the classic example) is the only one in which vascular resistance fails: vessels dilate, output rises to compensate, and tissues do not extract oxygen well, so SvO2 can be normal or high. Early on the skin is warm.
In the other three the body defends itself by constricting the vessels (high resistance) and the skin is cold. To separate them, look at preload: low in hypovolemic shock and high in cardiogenic and obstructive shock.
Common mistakes
Confusing cardiogenic with obstructive shock because both have a high CVP. The key is the cause and the examination: tamponade gives pulsus paradoxus and equalization of pressures; massive pulmonary embolism, right ventricular strain; tension pneumothorax, absent breath sounds and tracheal deviation.
Neurogenic shock (high spinal cord injury) should not be forgotten either: it is distributive but presents with bradycardia, not tachycardia.
In exam questions
Questions usually give catheter data or the clinical picture and ask for the type of shock. The quickest route is to look at the resistance first and then at the CVP.
Keep practicing
This page is the visual summary. To test yourself with real clinical reasoning, Medicinedle, the medical Wordle, gives you one clinical case a day: guess the diagnosis in six tries, with a new clue after every miss. It is free and available in English.