
What the chart shows
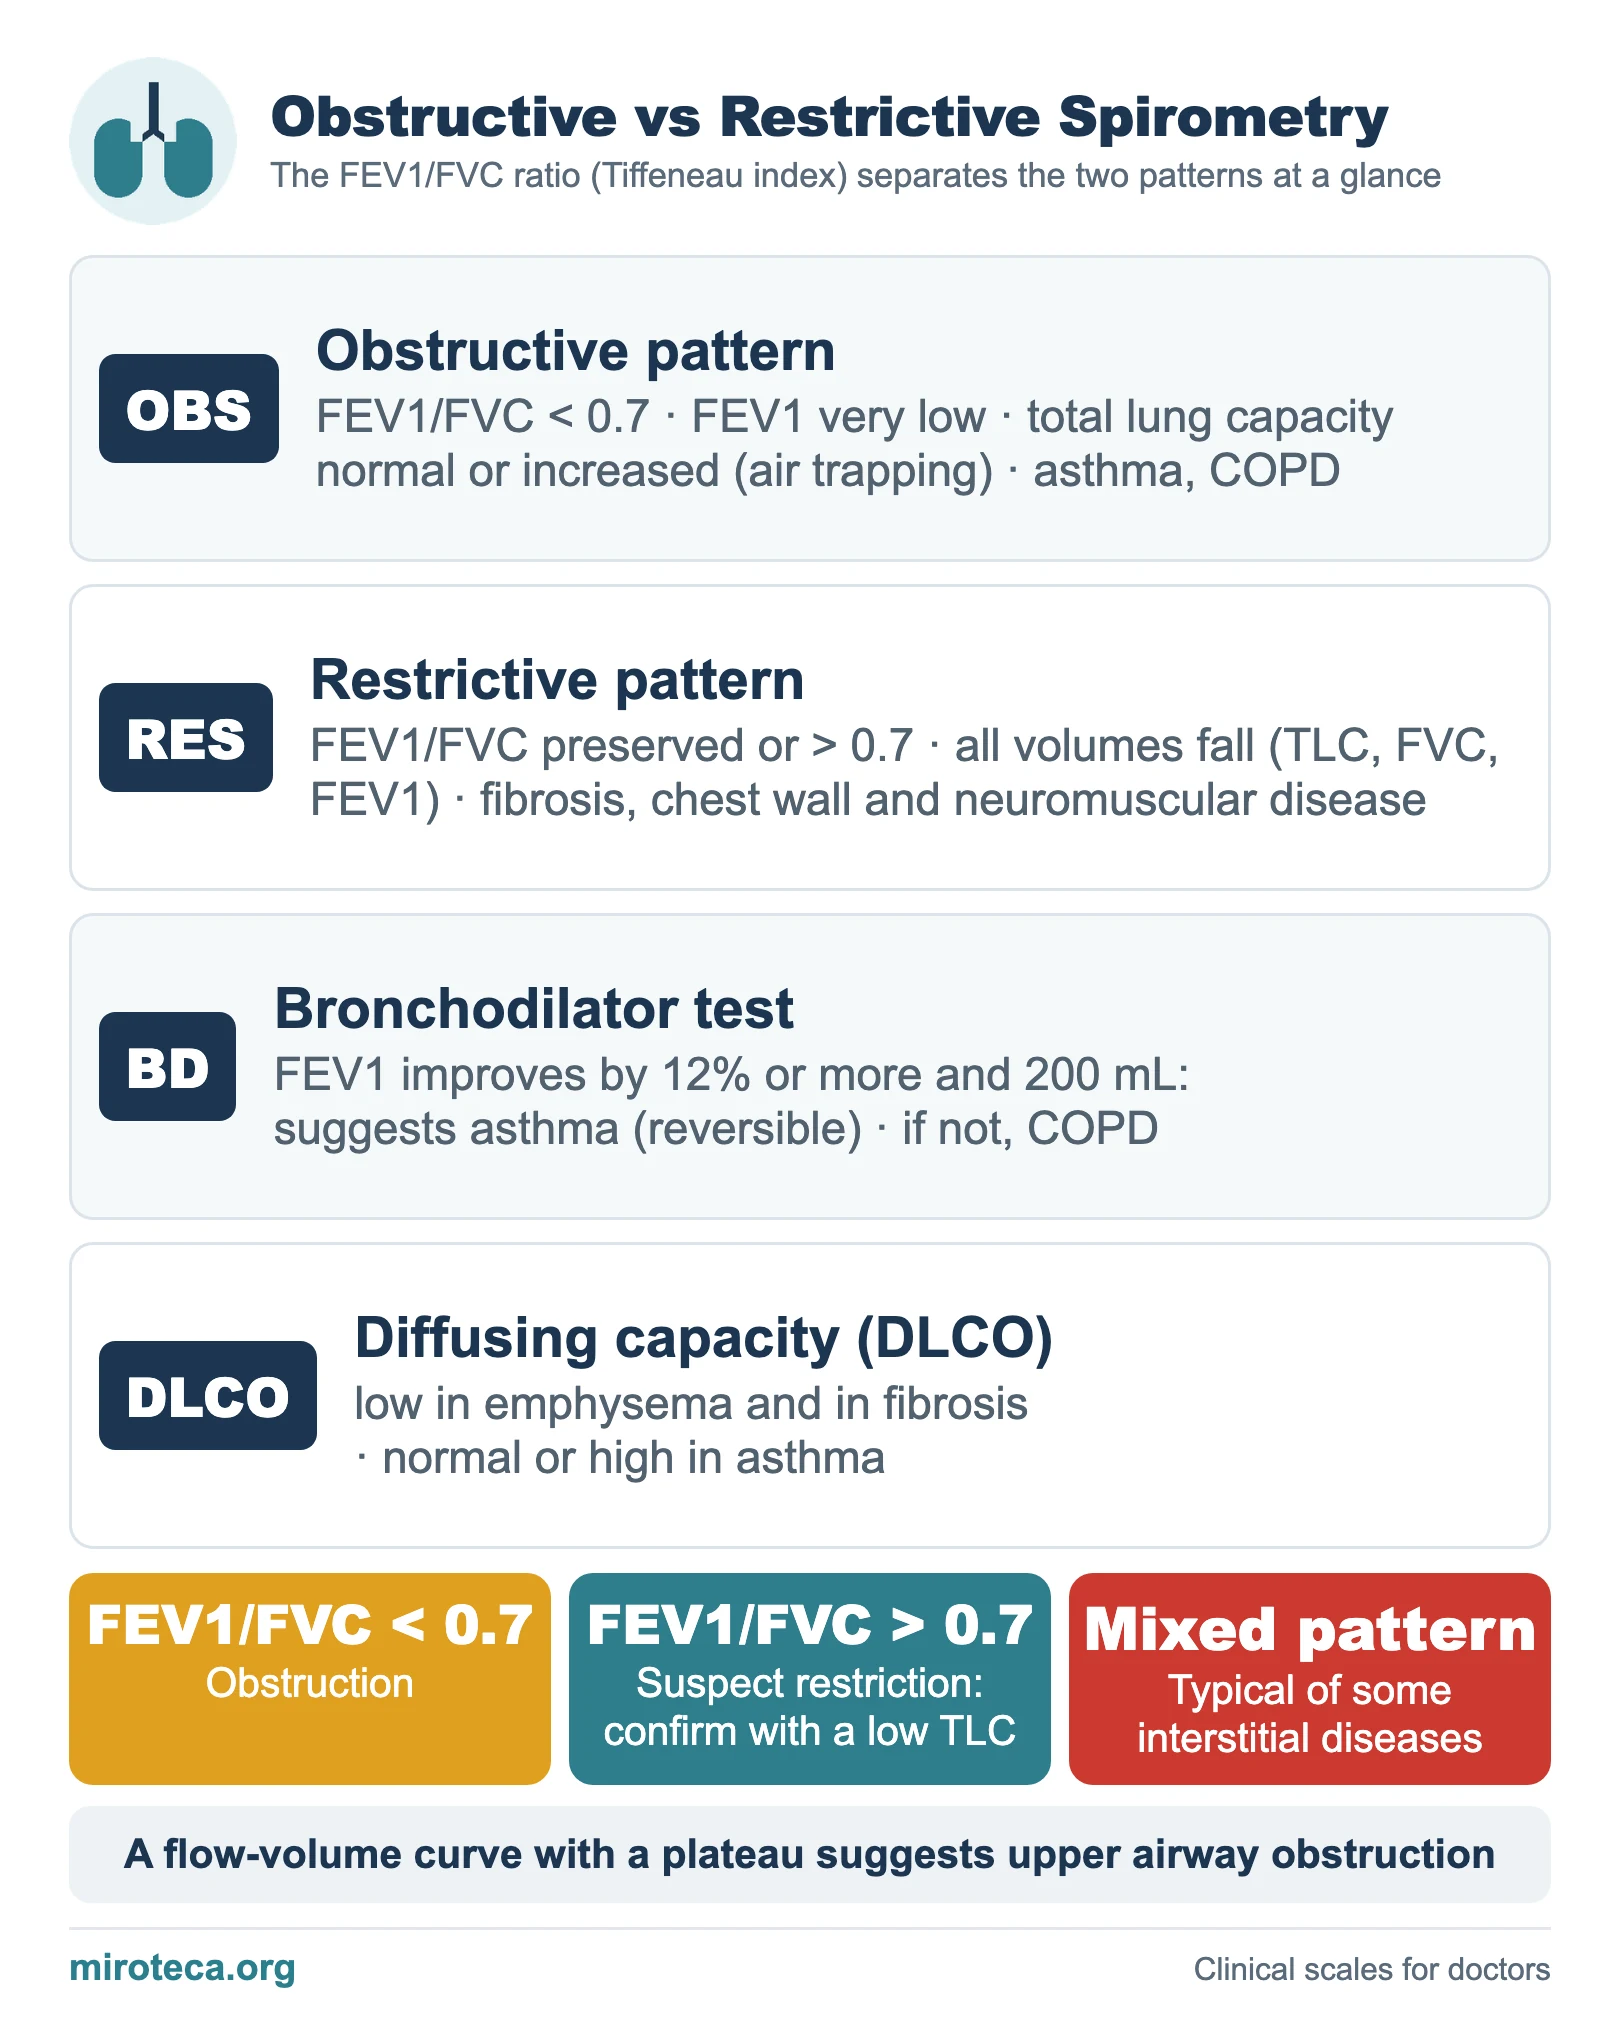
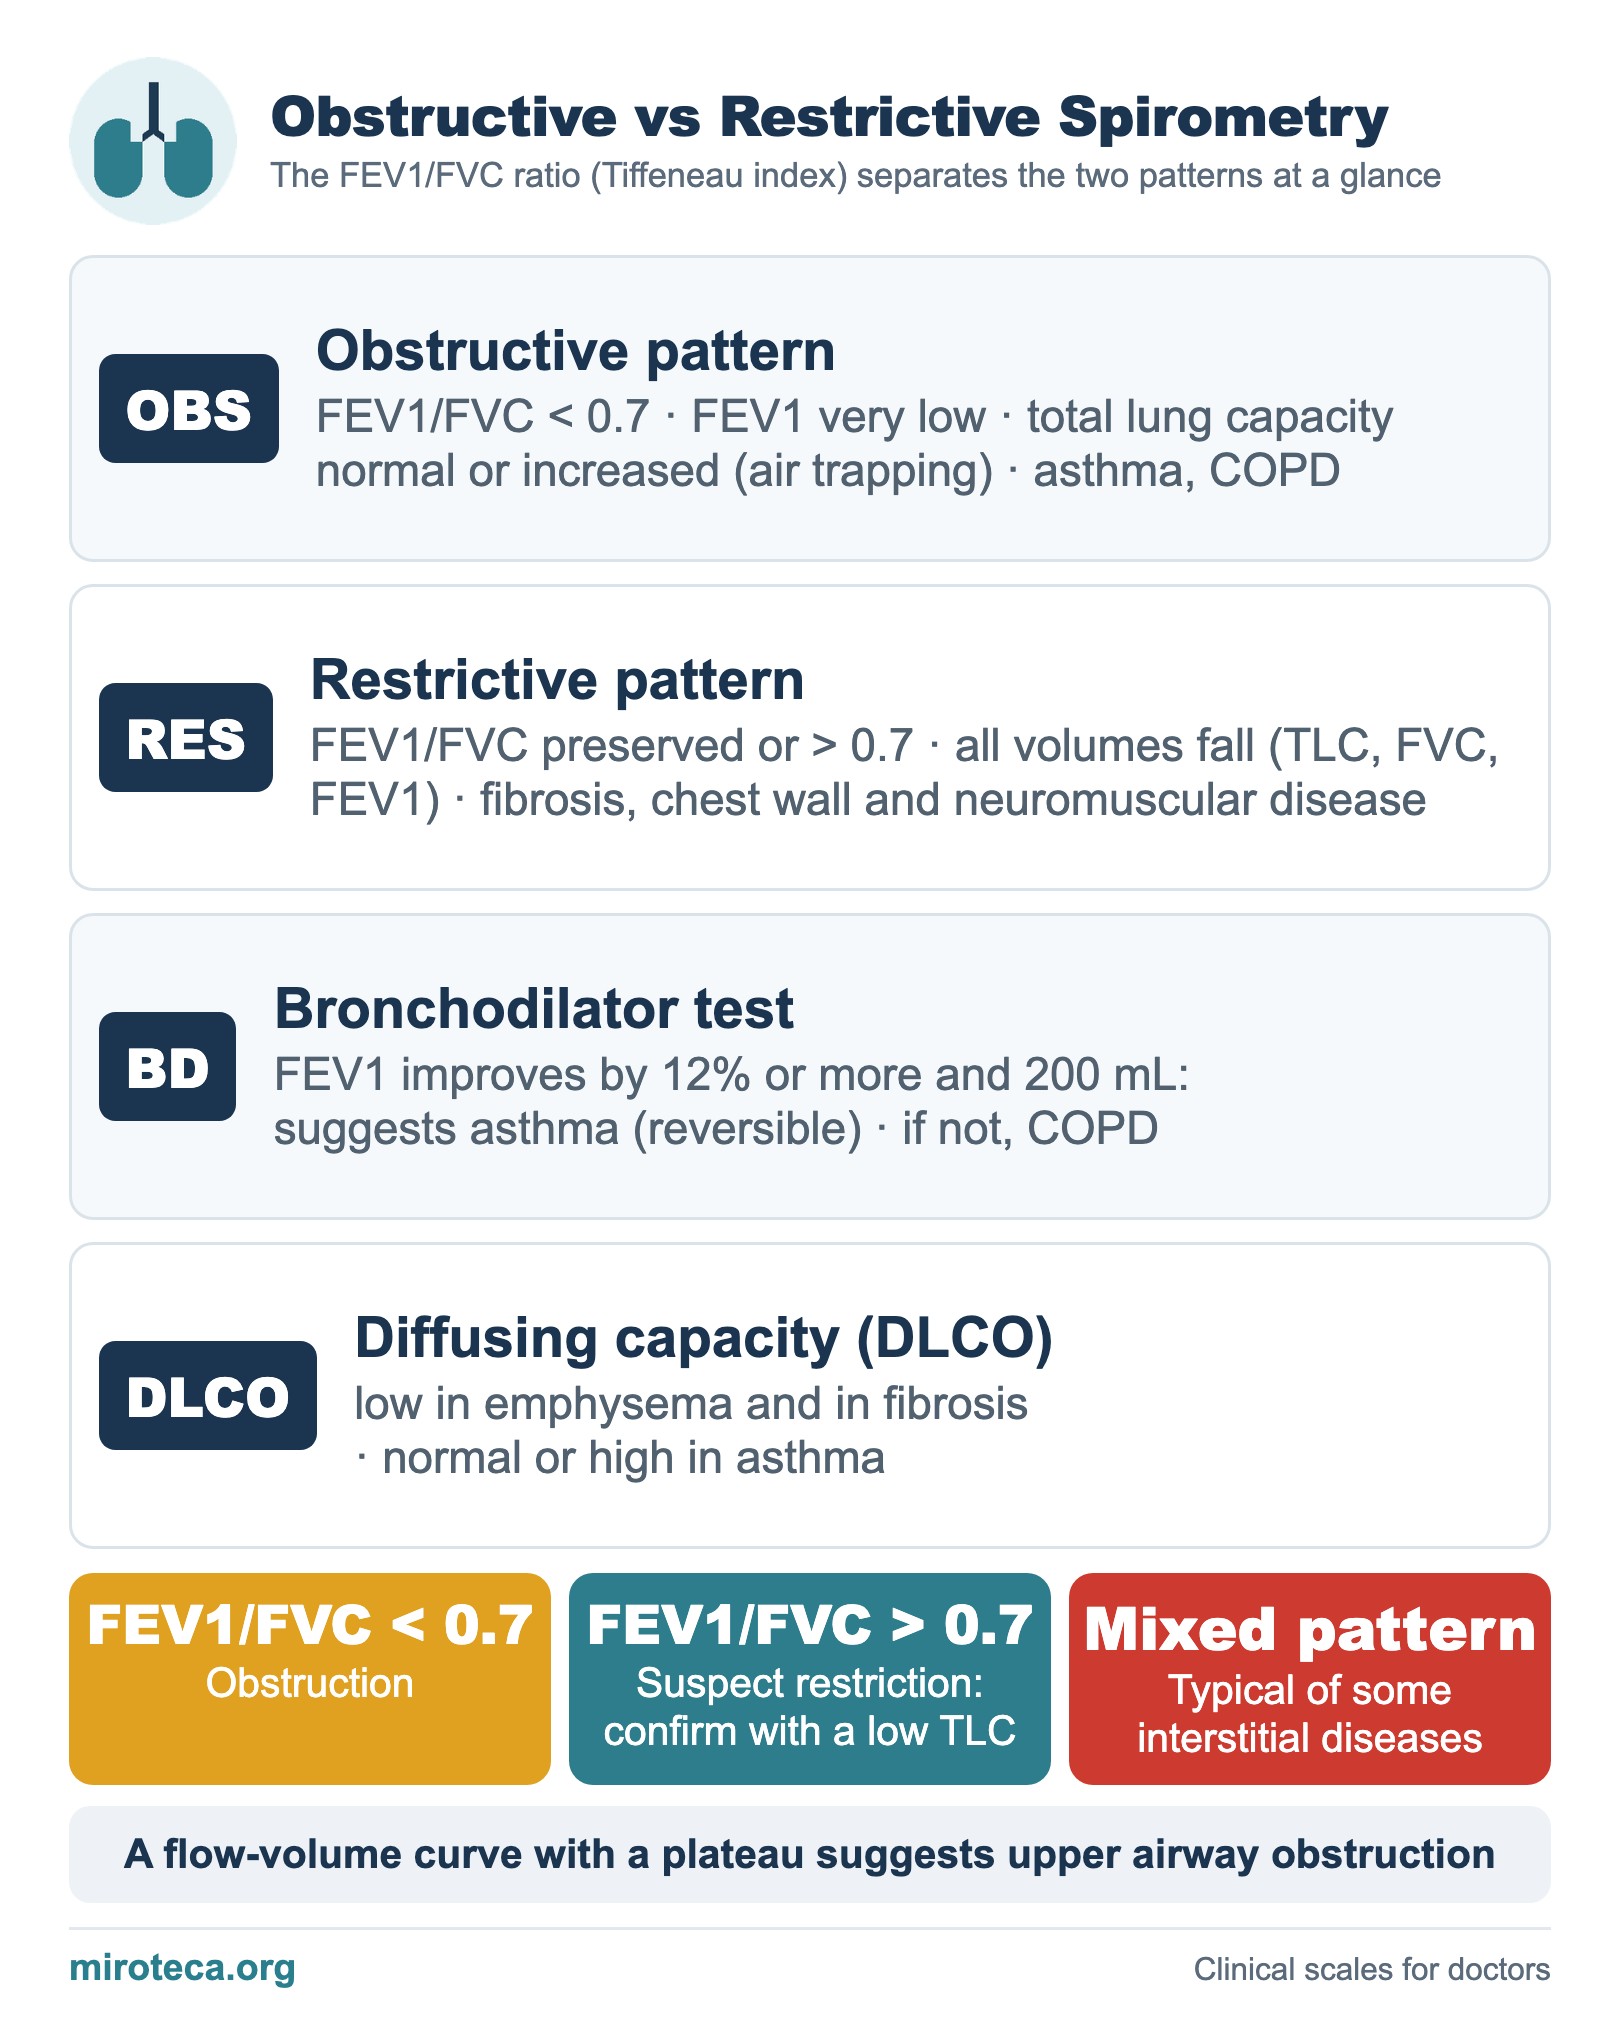
Spirometry separates two large patterns, obstructive and restrictive, and the figure that tells them apart at a glance is the FEV1/FVC ratio (Tiffeneau index). The chart contrasts both patterns and adds the bronchodilator test and the DLCO.
The detail that settles it
In the obstructive pattern (asthma, COPD) the FEV1/FVC ratio is below 0.7: FEV1 falls a lot and the total lung capacity can be normal or increased (air trapping). In the restrictive pattern (fibrosis, chest wall or neuromuscular disease) all volumes fall proportionally and the ratio is preserved or higher than 0.7.
The sequence is fixed: look first at the ratio. If it is below 0.7 the pattern is obstructive; if it is preserved or rises, suspect restriction and confirm it with a reduced total lung capacity, the finding that truly defines restriction.
In exam questions
In obstruction, a bronchodilator test is done: an FEV1 improvement of 12% or more and 200 mL points to asthma (reversible); if not, to COPD. The DLCO refines the picture: low in emphysema and fibrosis, normal or high in asthma. Mixed patterns (obstruction plus restriction) are typical of some interstitial diseases, and a flow-volume curve with a plateau suggests upper airway obstruction. See also UIP vs NSIP.
Keep practicing
This page is the visual summary. To test yourself with real clinical reasoning, Medicinedle, a Wordle-inspired game, gives you one clinical case a day: guess the diagnosis in six tries, with a new clue after every miss. It is free and available in English.