
What the chart shows
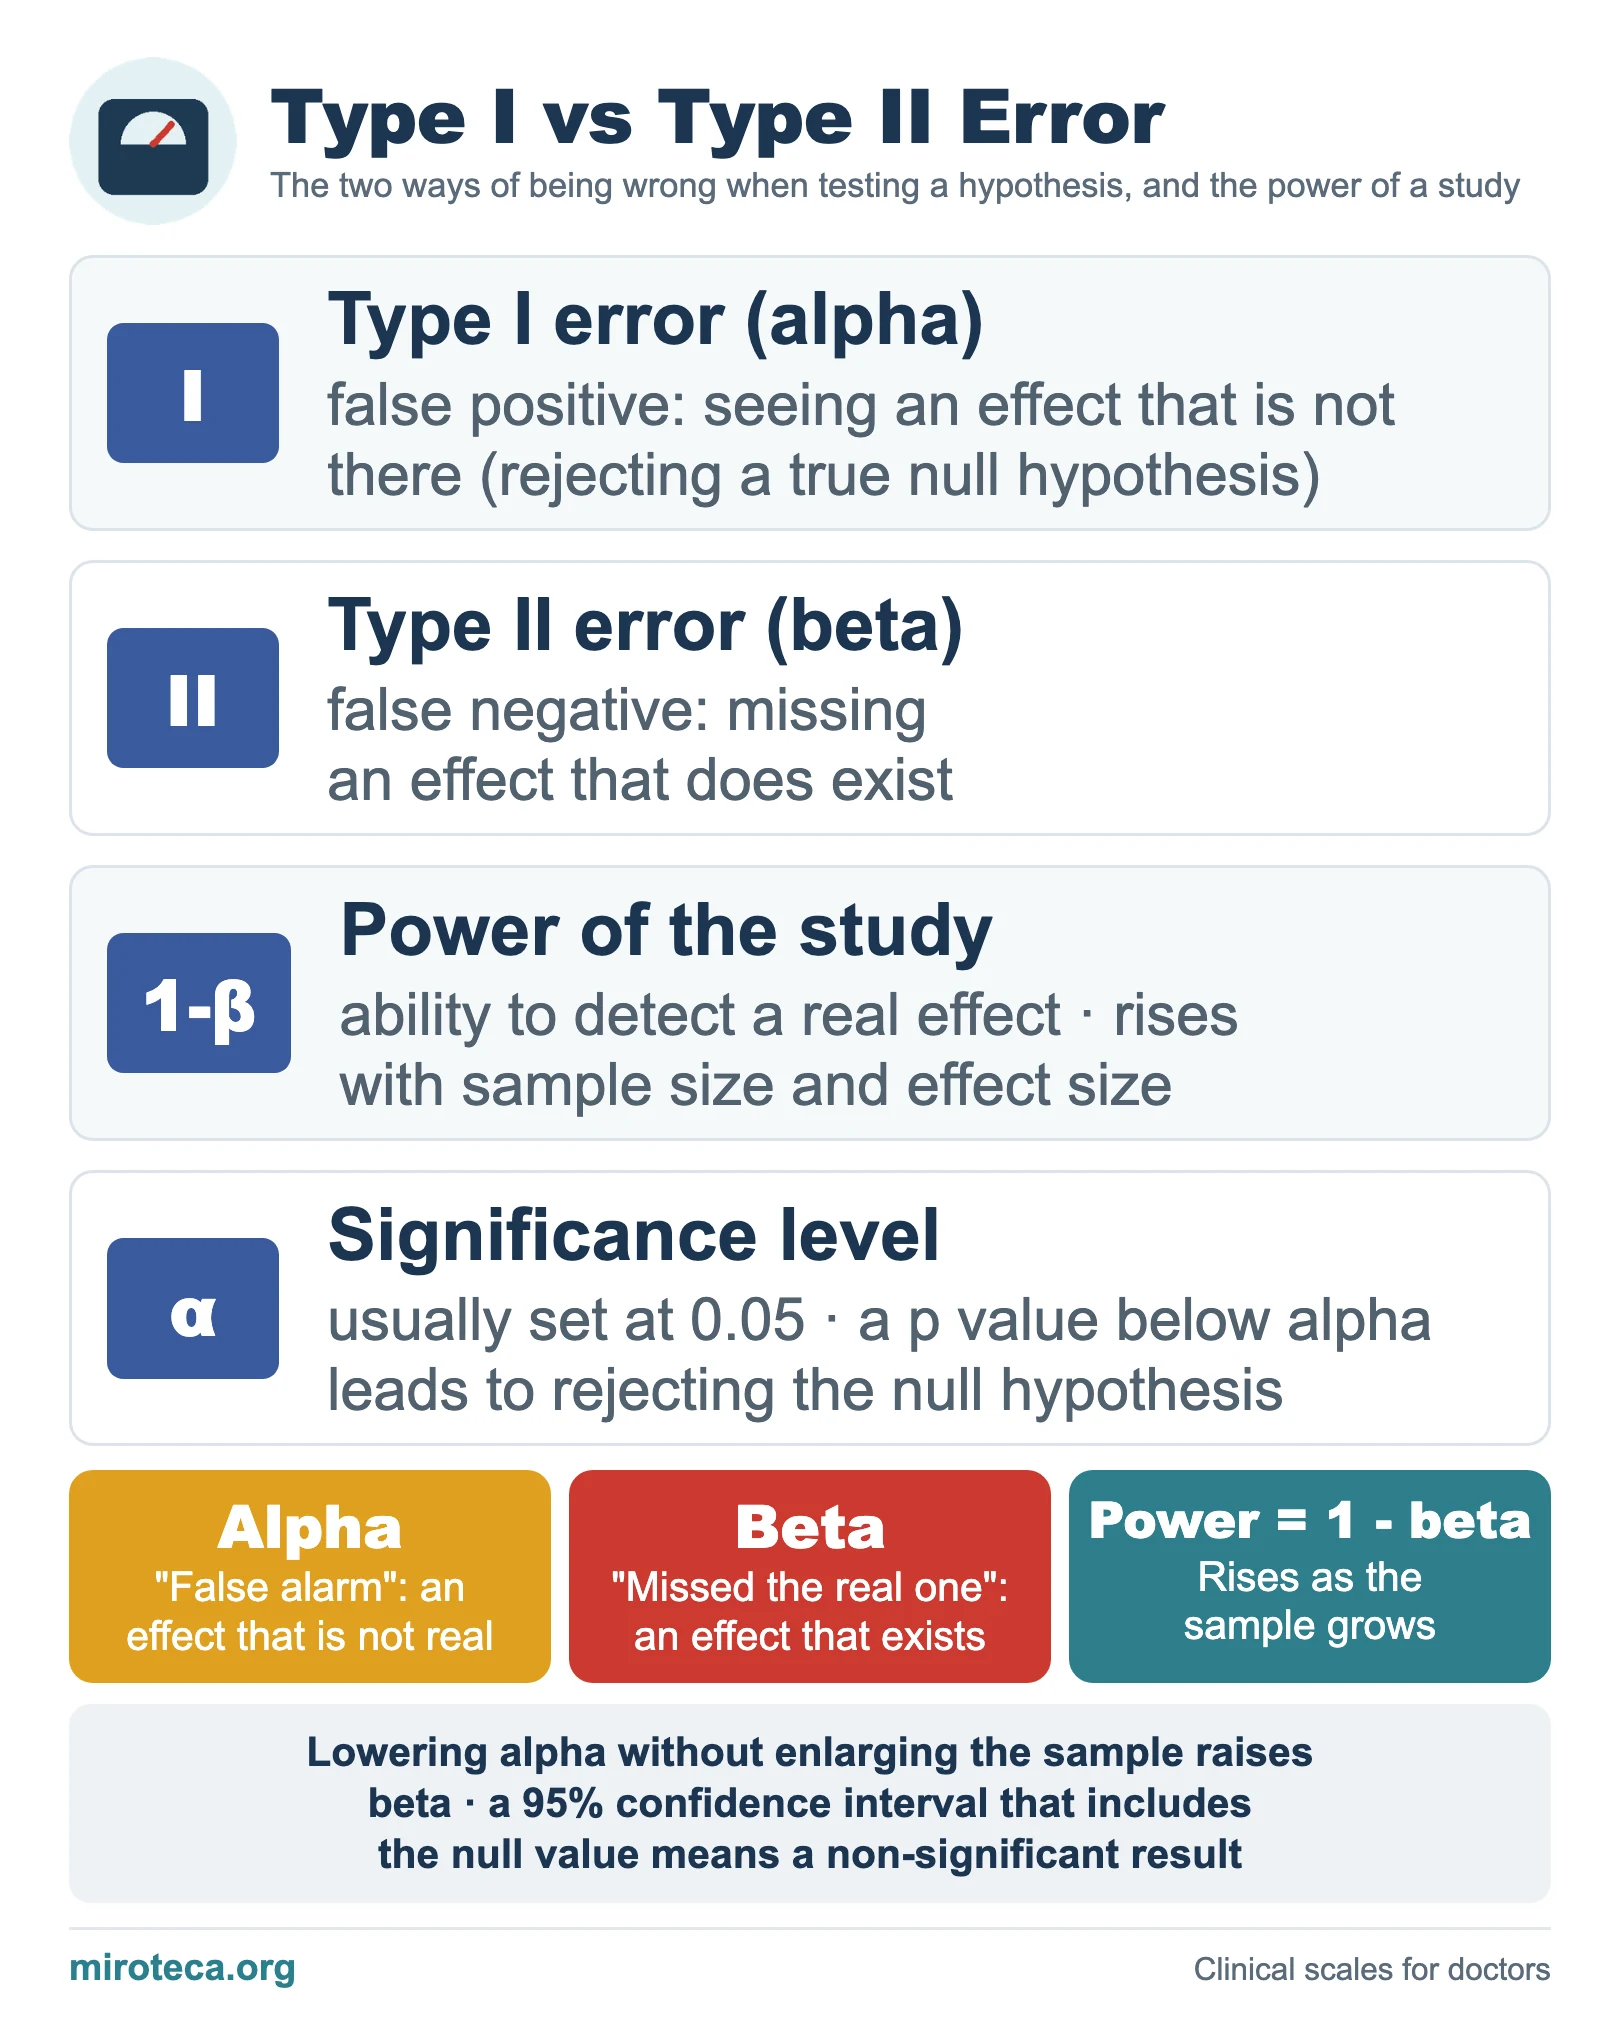
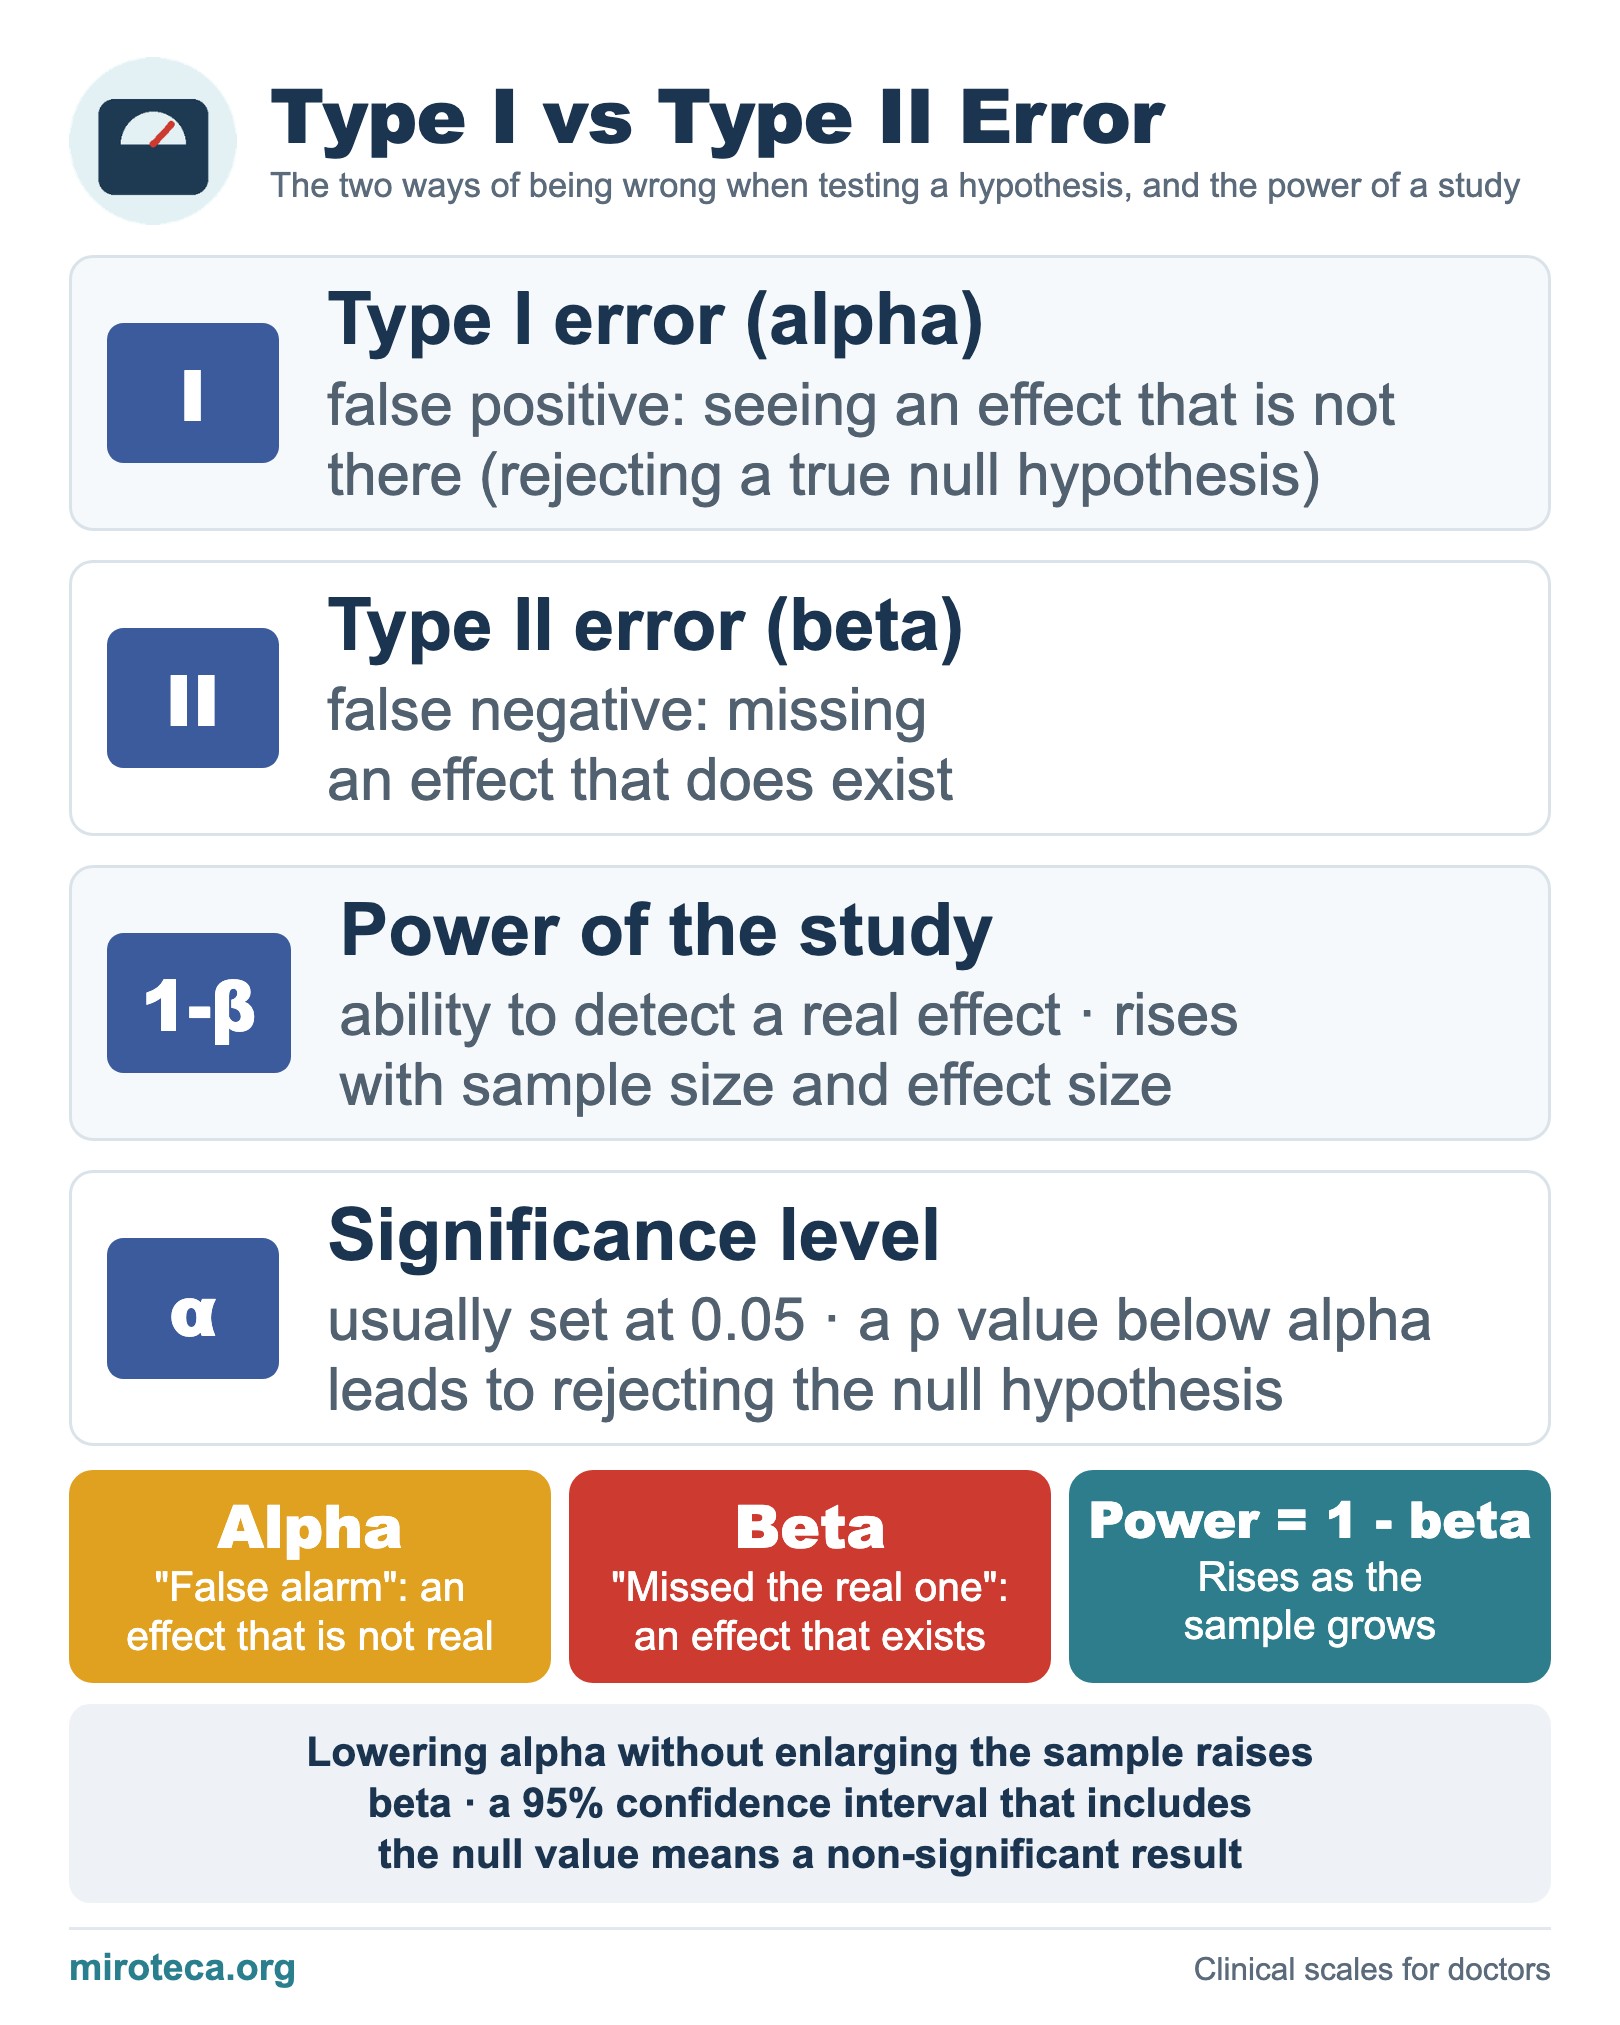
When a hypothesis is tested there are two ways of being wrong. The chart contrasts the type I error (alpha) with the type II error (beta) and adds the power of the study and the significance level.
The detail that settles it
A type I error is a false positive: concluding that there is an effect when there is not (rejecting a true null hypothesis). A type II error is a false negative: not detecting an effect that does exist. A memory aid: alpha is the "false alarm"; beta is "missed what was real".
The power of a study is 1 minus beta: its ability to detect a real effect. It rises with the sample size and with the effect size. The significance level sets alpha, usually at 0.05, and a p value below alpha leads to rejecting the null hypothesis.
In exam questions
Short rules: lowering alpha (being more demanding) without enlarging the sample raises beta, so both must be balanced; a 95% confidence interval that includes the null value is equivalent to a non-significant result; power rises as the sample size grows.
Keep practicing
This page is the visual summary. To test yourself with real clinical reasoning, Medicinedle, a Wordle-inspired game, gives you one clinical case a day: guess the diagnosis in six tries, with a new clue after every miss. It is free and available in English.