
What the diagram shows
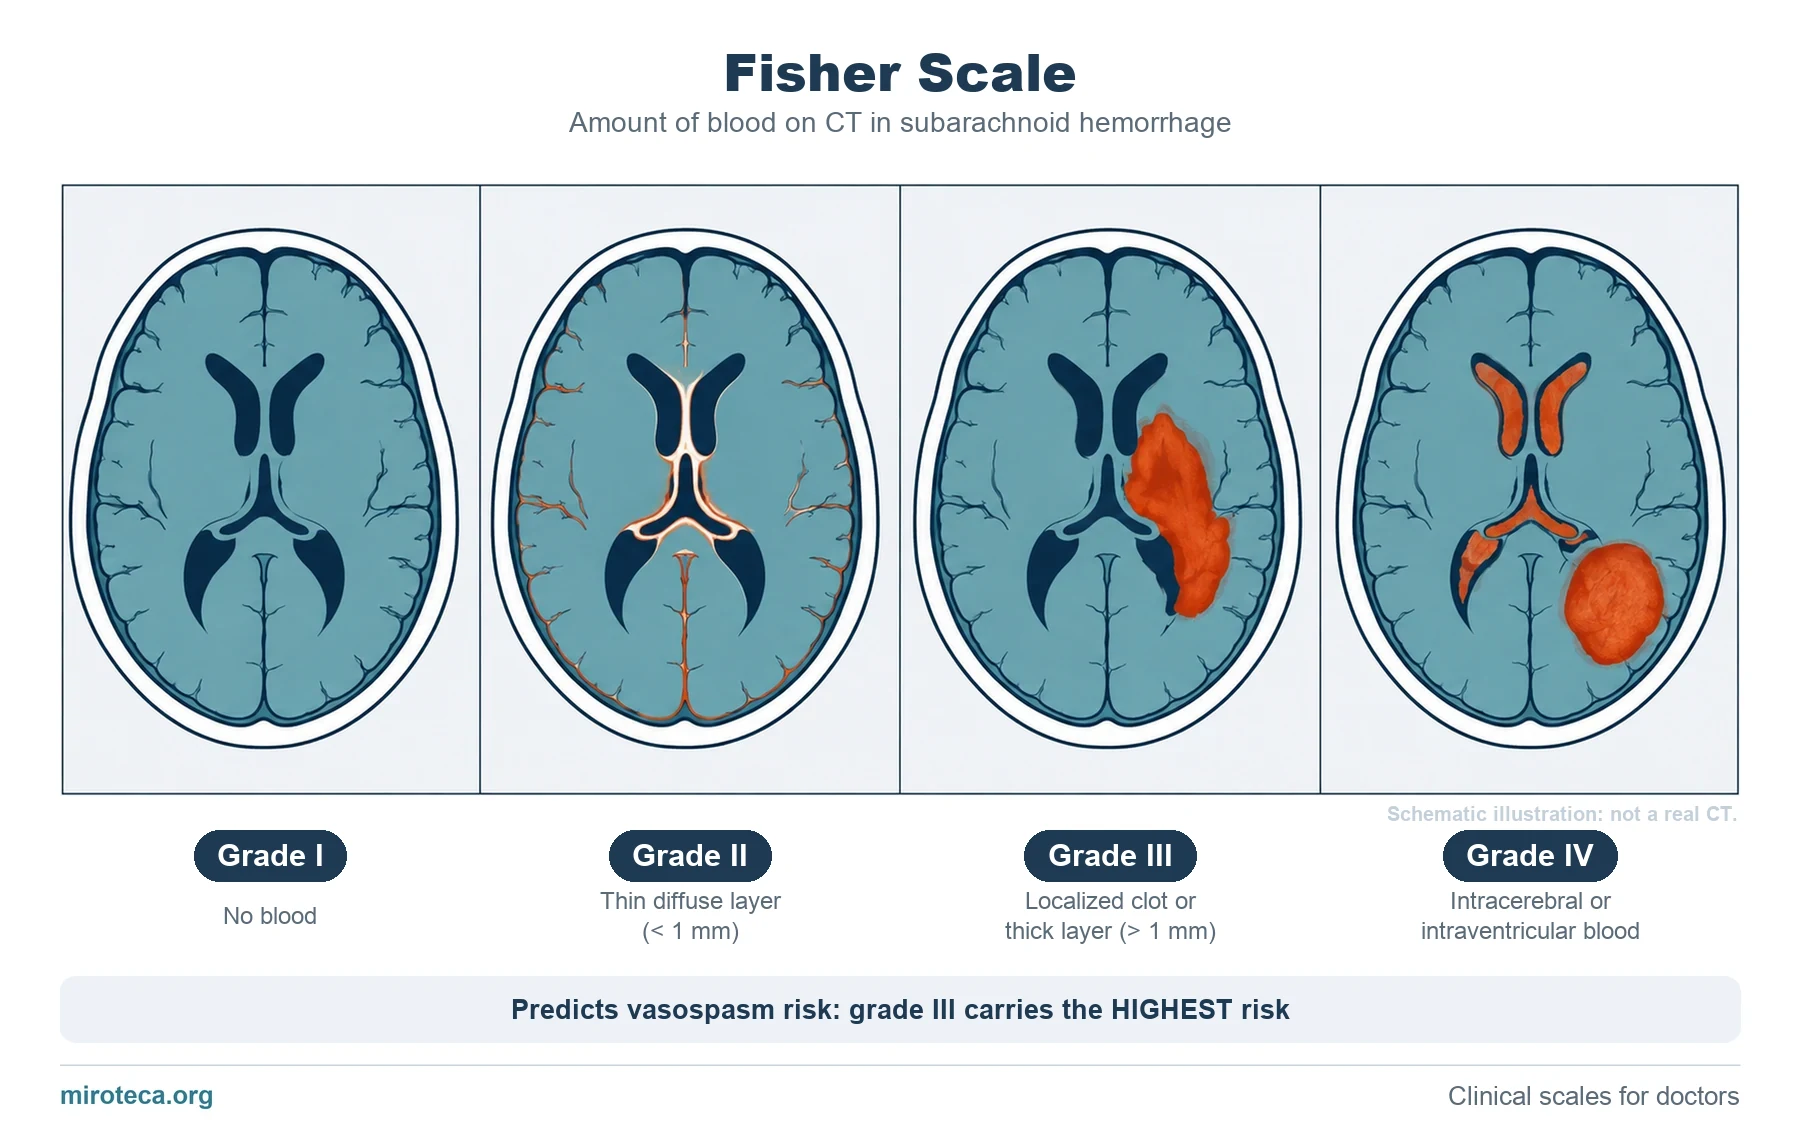
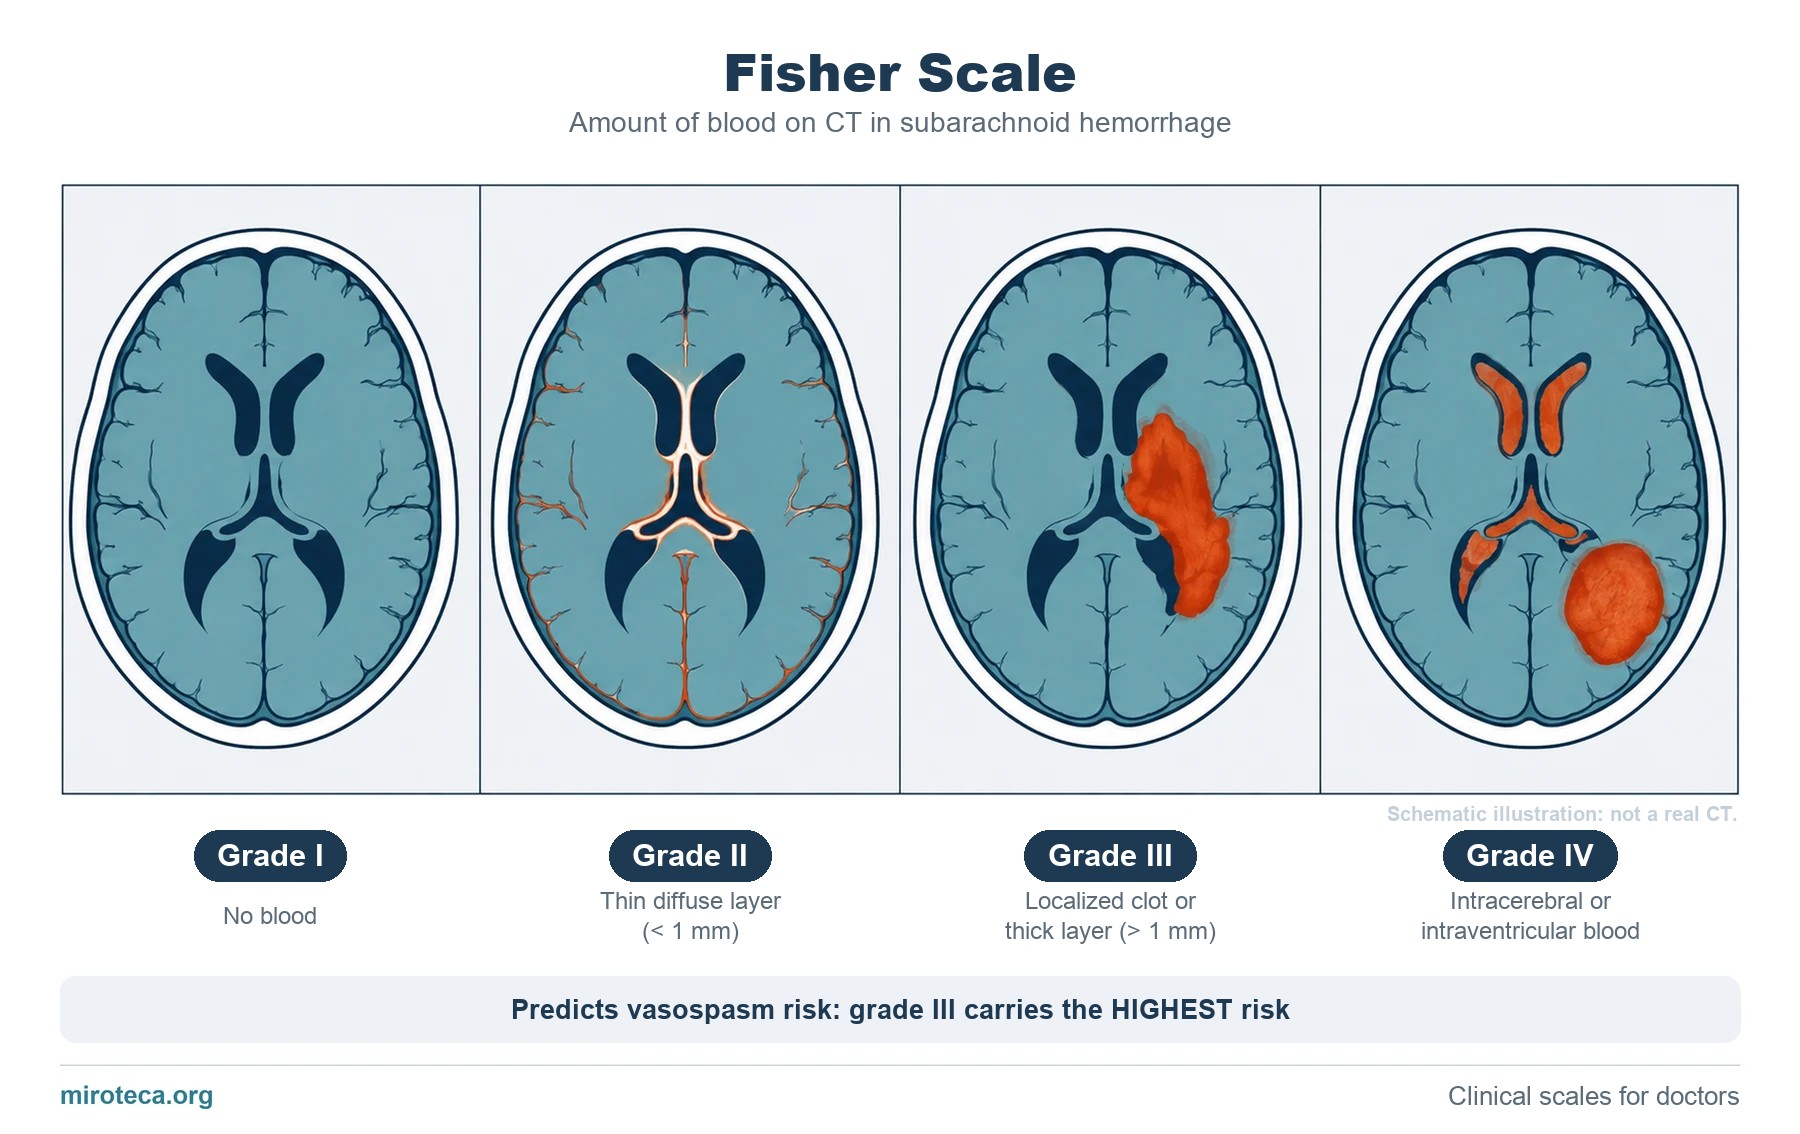
The Fisher scale classifies how much blood is seen on CT in a subarachnoid hemorrhage, and it is used to estimate the risk of vasospasm.
The diagram is a teaching illustration, not a real CT: it is drawn this way on purpose so that the cisterns and ventricles are easy to tell apart.
The detail that settles it
The surprise is that vasospasm risk does NOT rise in a straight line: it peaks at grade III, not IV. Vasospasm is caused by blood in contact with the arteries in the cisterns, and in grade IV much of the blood is inside the parenchyma or the ventricles.
Common mistakes
The most repeated mistake is assuming that grade IV is always the worst in every respect. For vasospasm, grade III carries the highest risk.
Another is confusing Fisher with clinical scales such as Hunt and Hess: Fisher describes the IMAGE, Hunt and Hess describe the PATIENT.
Keep practicing
This page is the visual summary. To test yourself with real clinical reasoning, Medicinedle, a Wordle-inspired game, gives you one clinical case a day: guess the diagnosis in six tries, with a new clue after every miss. It is free and available in English.