
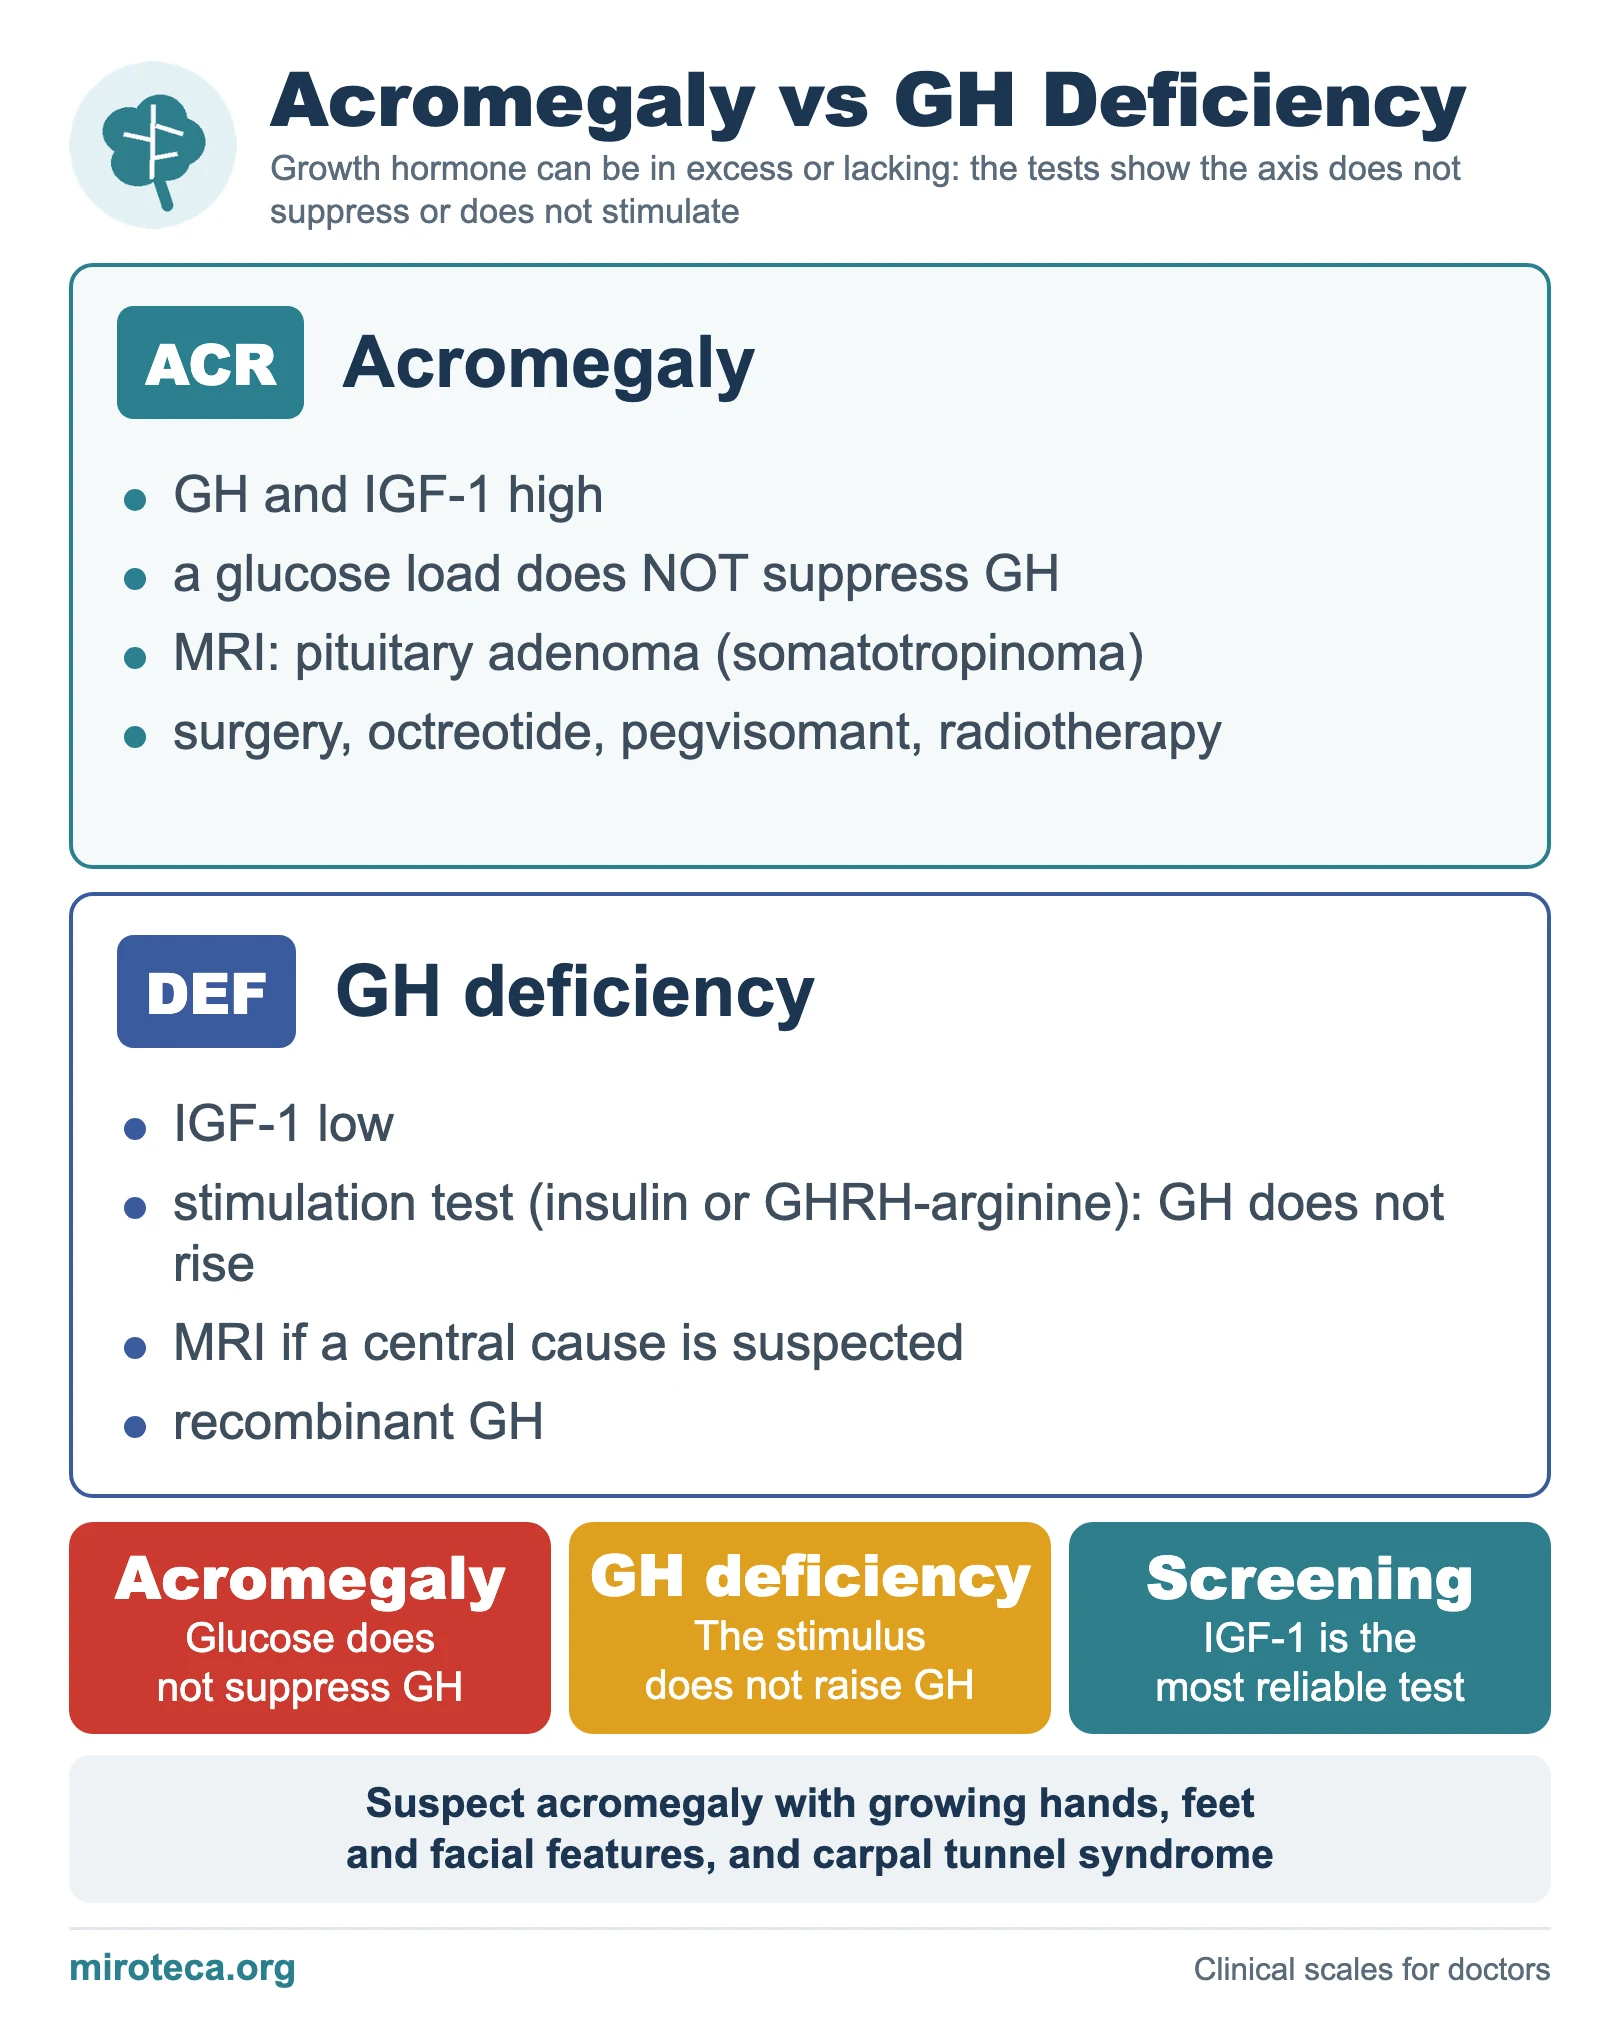
What the chart shows
Growth hormone (GH) can be in excess (acromegaly) or lacking (GH deficiency). The trick of the tests is that they rely on showing that the axis "does not suppress" or "does not stimulate" as it should.
The detail that settles it
In acromegaly, GH and IGF-1 are elevated and, characteristically, the oral glucose load does NOT suppress GH; the MRI shows a pituitary adenoma (somatotropinoma). Treatment is transsphenoidal surgery and, if that is not enough, somatostatin analogs (octreotide), pegvisomant or radiotherapy. In GH deficiency, IGF-1 is low and, in stimulation tests (insulin hypoglycemia or GHRH-arginine), GH does not rise; it is treated with recombinant GH.
In exam questions
Short rules: acromegaly means glucose does not suppress GH; deficiency means the stimulus does not raise it; IGF-1 is the most reliable screening data; acromegaly is suspected with enlargement of the hands, feet and facial features and carpal tunnel syndrome.
Keep practicing
This page is the visual summary. To test yourself with real clinical reasoning, Medicinedle, a Wordle-inspired game, gives you one clinical case a day: guess the diagnosis in six tries, with a new clue after every miss. It is free and available in English.