
What the diagram shows
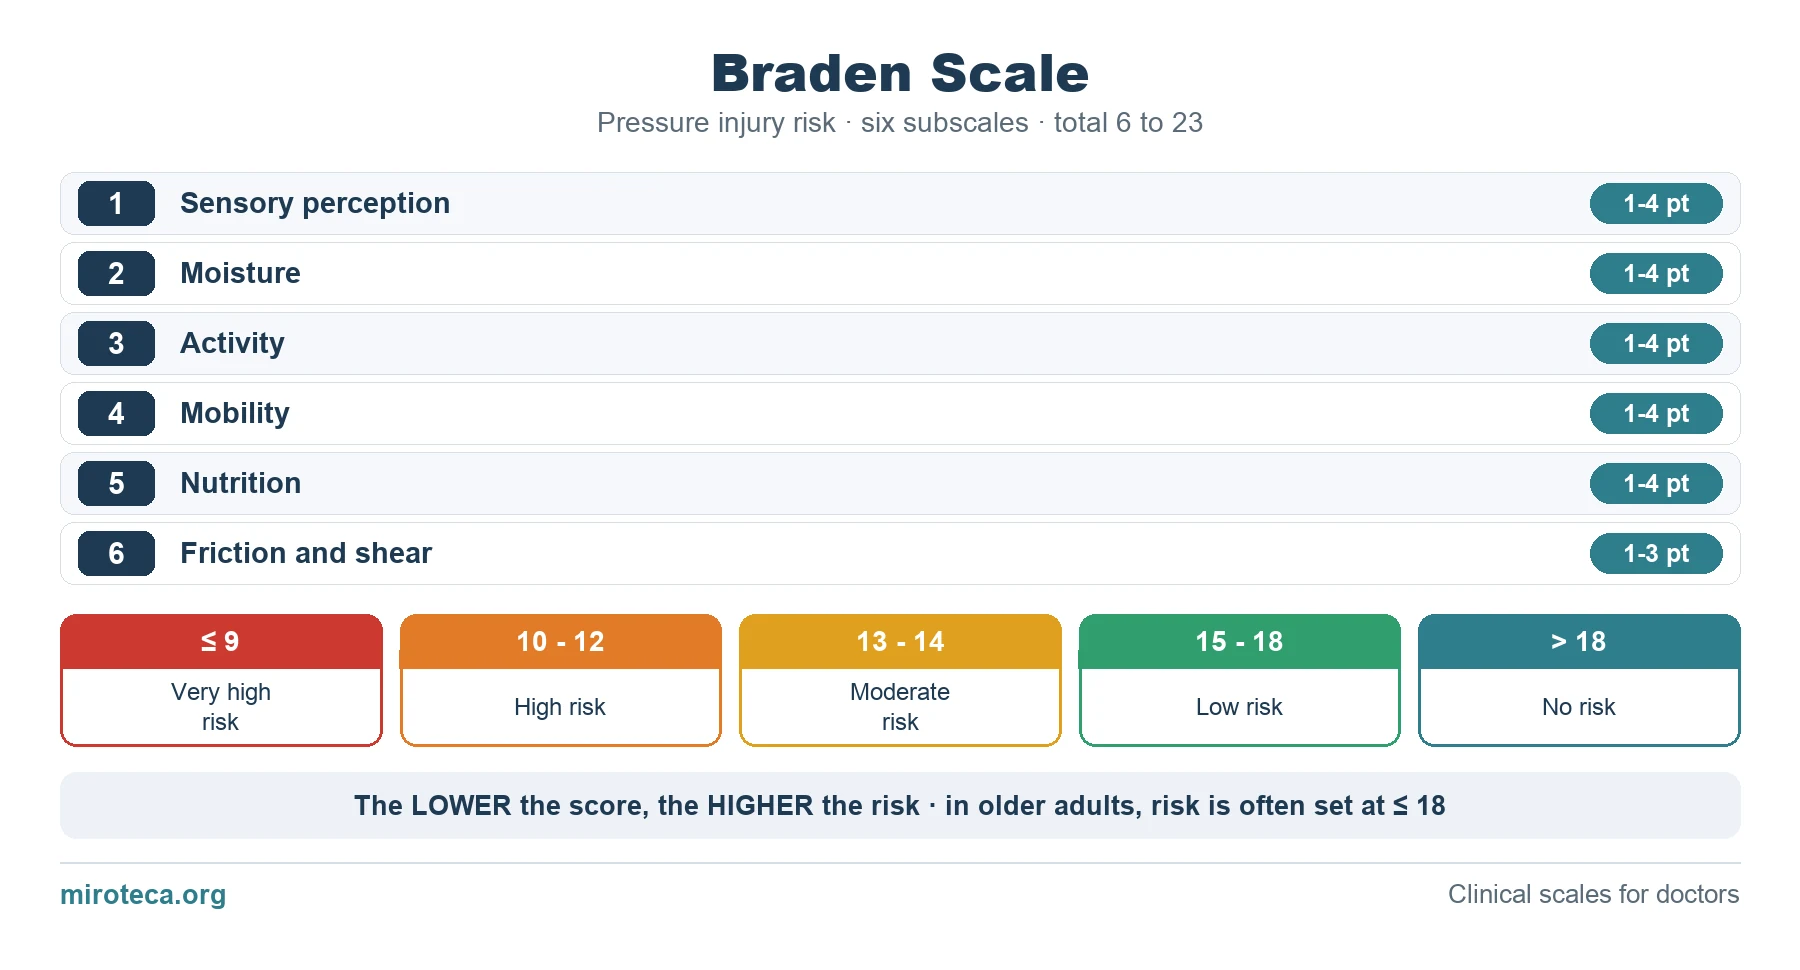
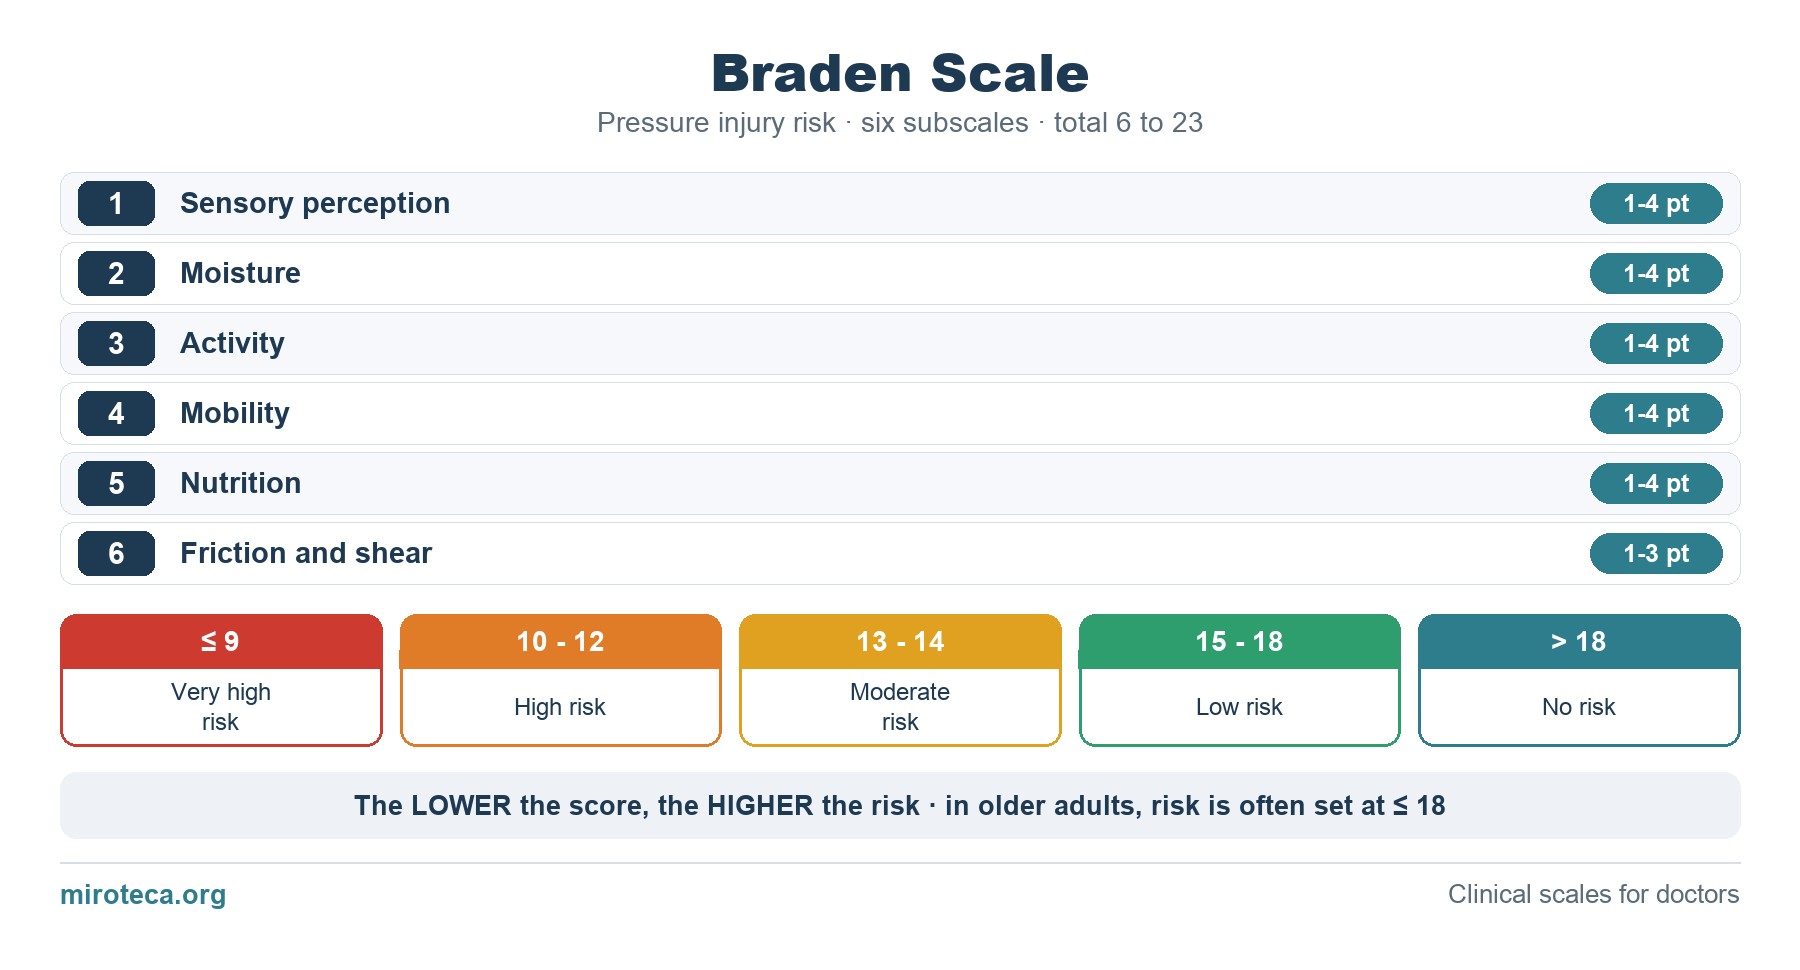
The Braden scale estimates the risk of pressure injuries with six subscales: sensory perception, moisture, activity, mobility, nutrition, and friction and shear. Five are scored 1 to 4 and friction and shear 1 to 3, for a total of 6 to 23.
The detail that settles it
It runs backwards: fewer points mean more risk. A score of 16 or less is commonly taken as at risk, and 18 or less is often used in older adults.
Its strength is that it analyzes causes (moisture, nutrition, friction), which helps to choose a specific preventive measure.
Common mistakes
Forgetting that a lower score means a higher risk.
Not using the subscales, which exist precisely to show which cause to correct.
In exam questions
Nursing questions (NCLEX) usually give a patient's subscale findings and ask for the total, the risk level or the priority intervention, which follows from the lowest subscale.
Keep practicing
This page is the visual summary. To test yourself with real clinical reasoning, Medicinedle, a Wordle-inspired game, gives you one clinical case a day: guess the diagnosis in six tries, with a new clue after every miss. It is free and available in English.