
What the diagram shows
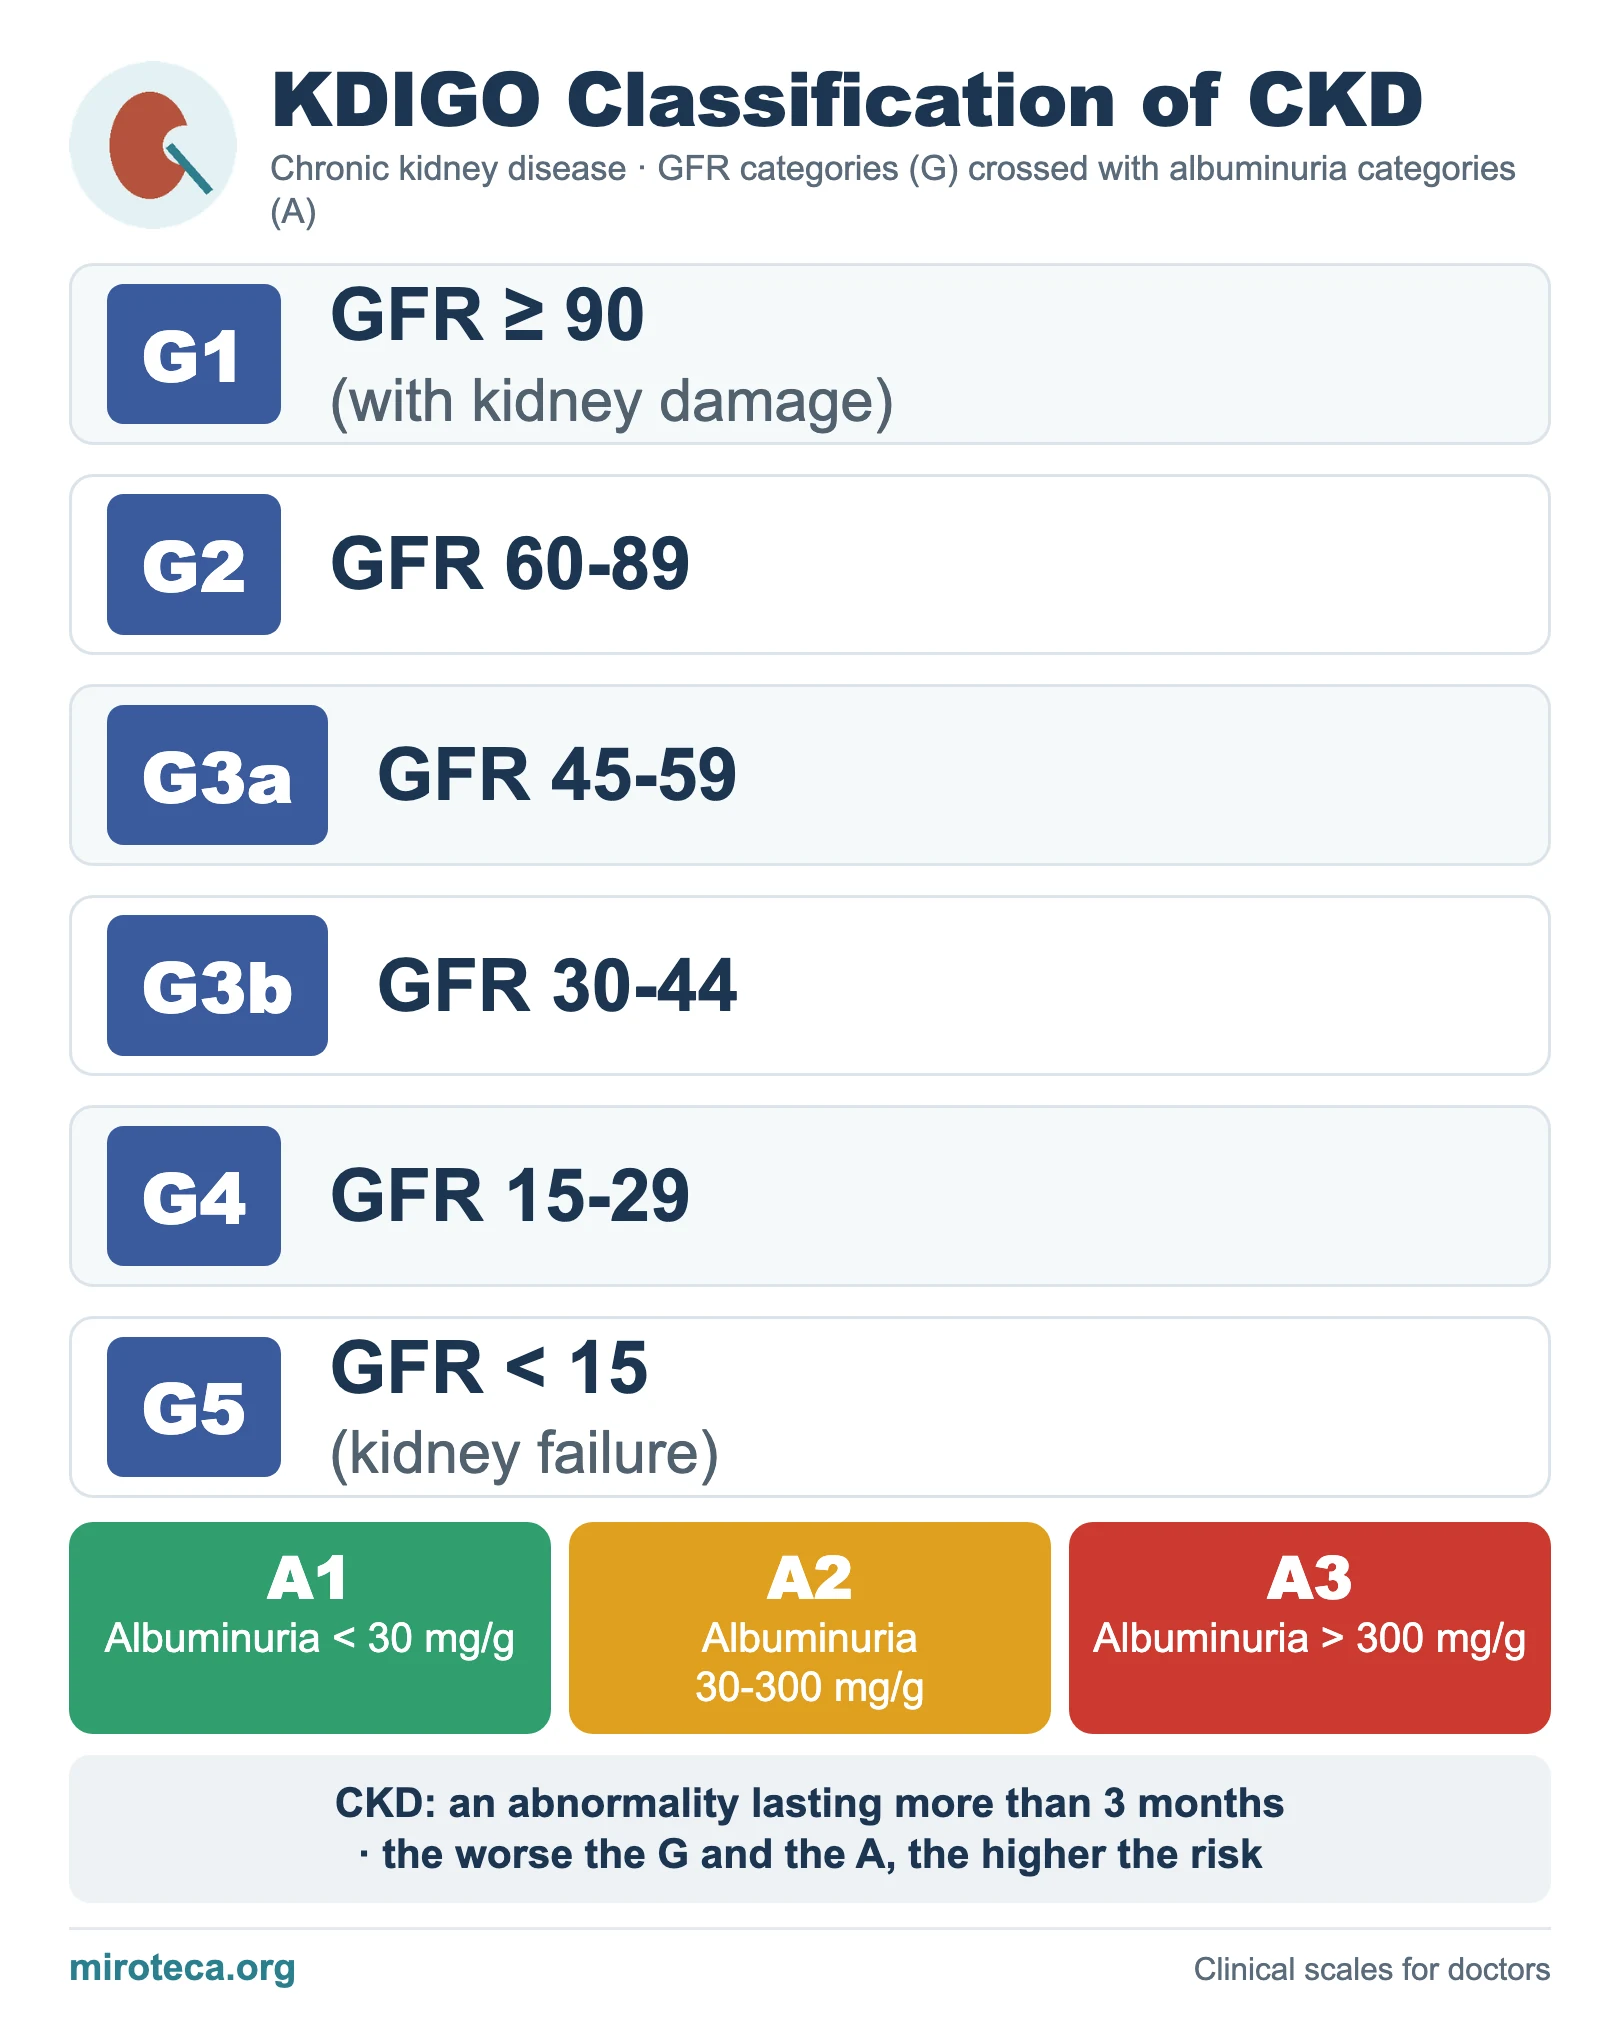
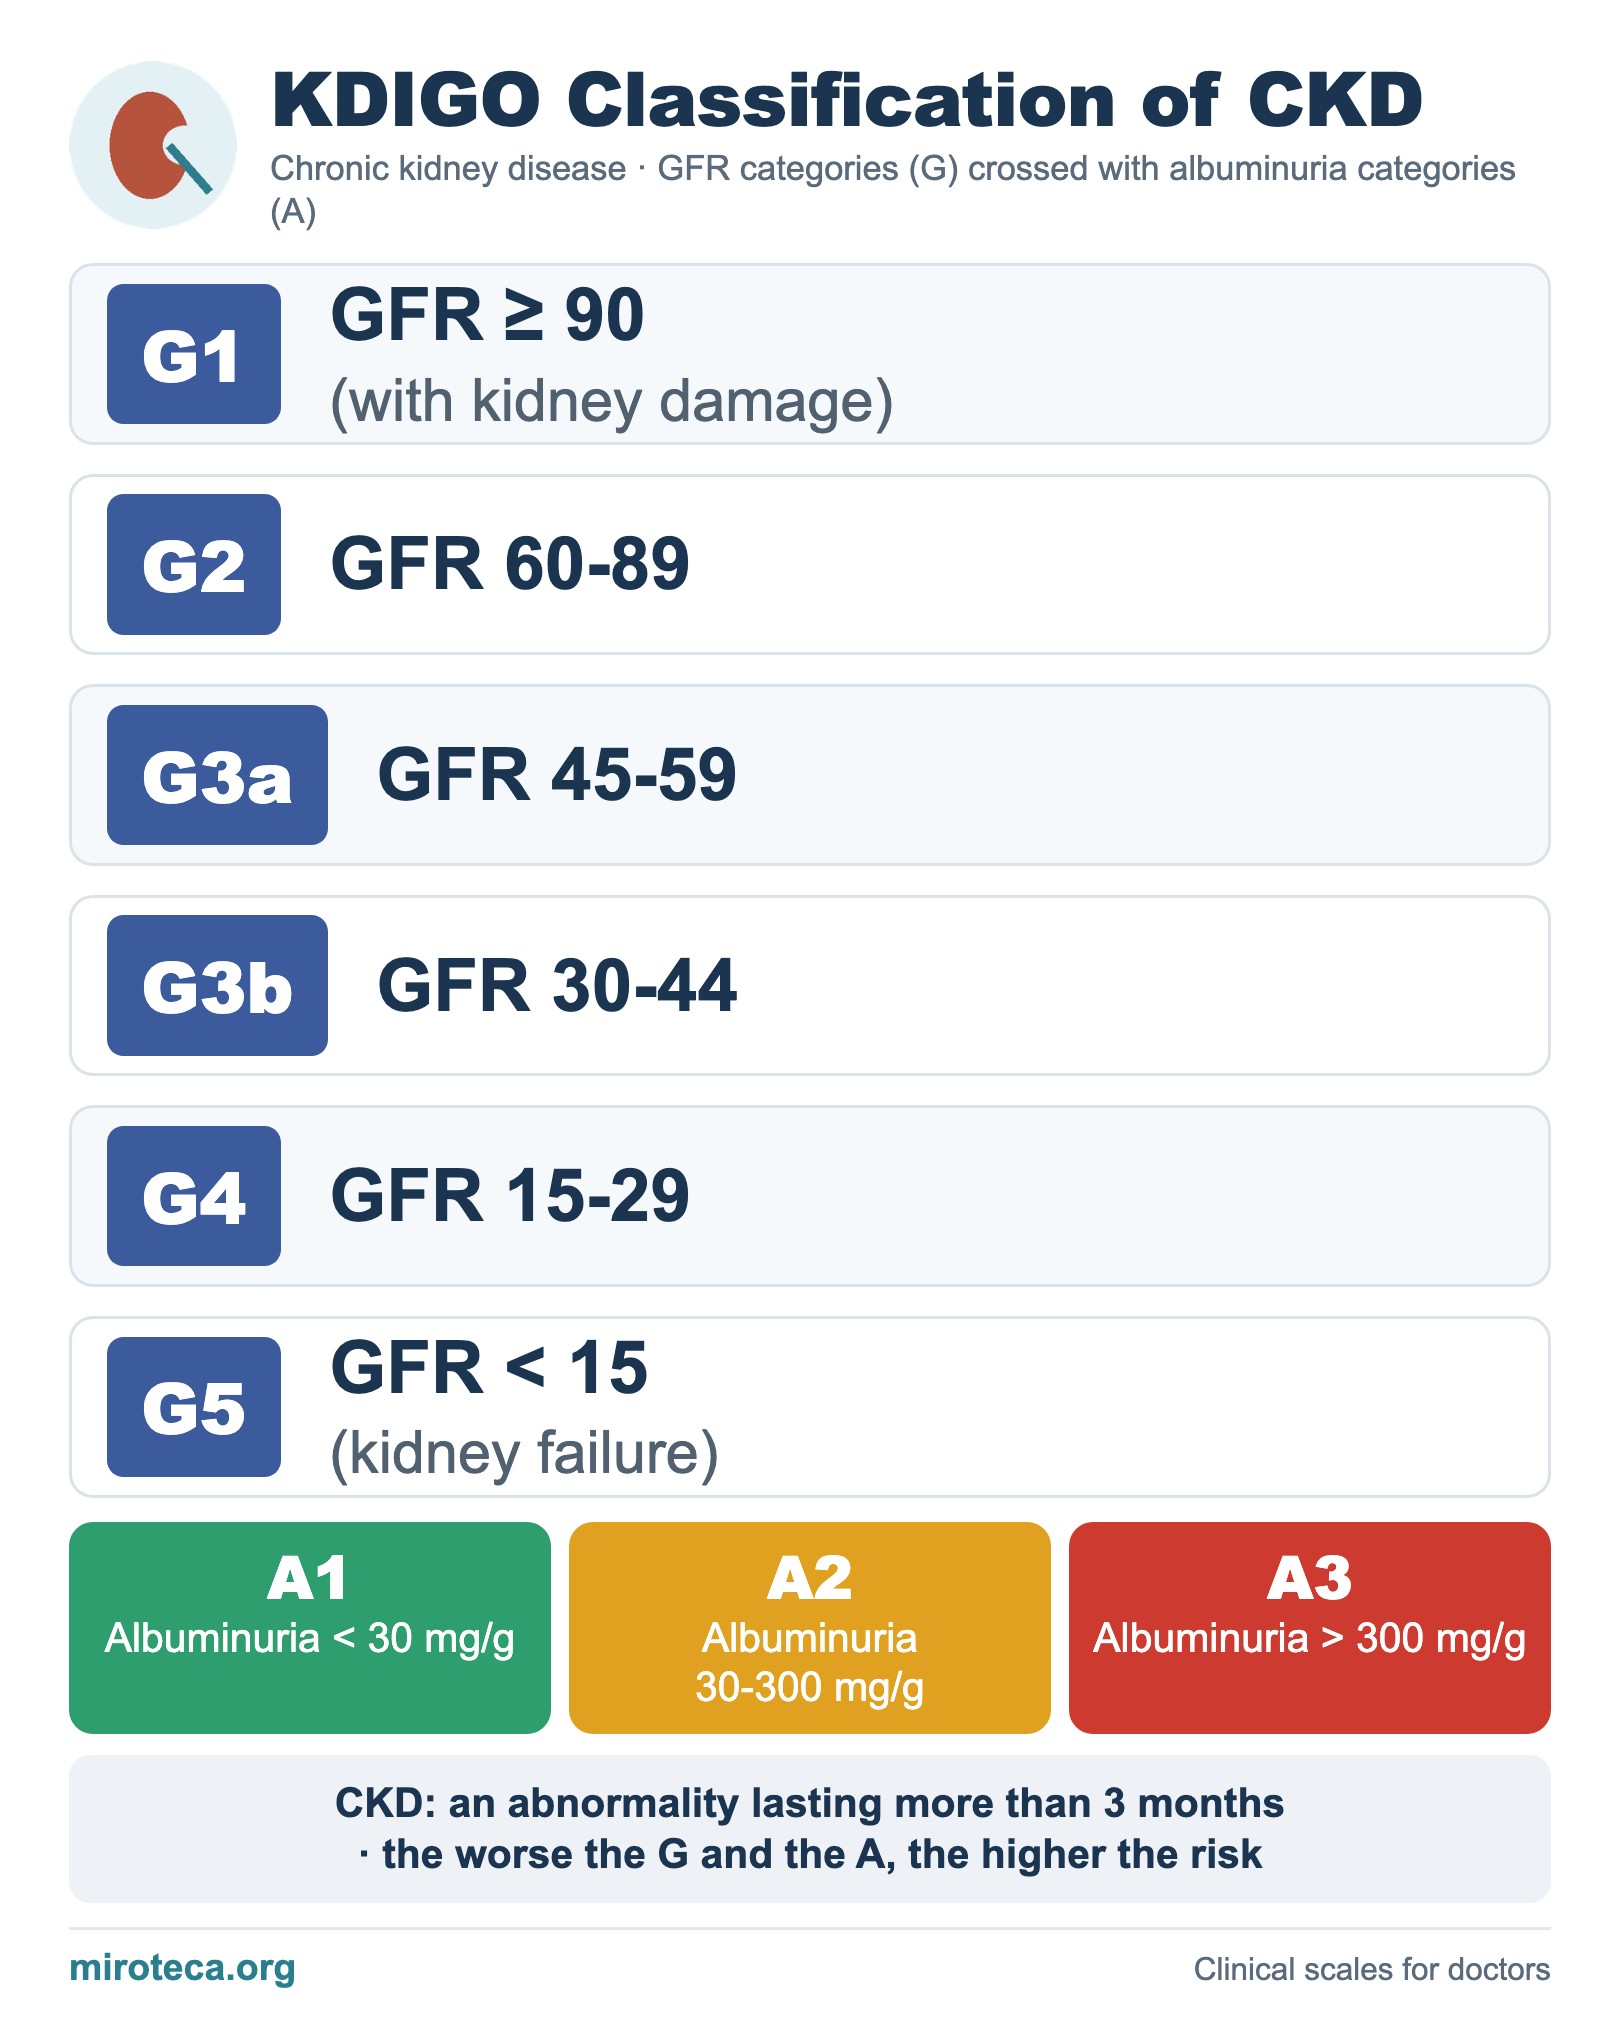
The KDIGO classification stages chronic kidney disease (CKD) by crossing two axes: the glomerular filtration rate (G categories) and albuminuria (A categories). It gives a more complete picture of risk than the filtration rate alone.
The patient is placed in one cell of the map by crossing the G category with the A category. A color map shows the risk of progression and of events: the worse the G and the A, the higher the risk.
The detail that settles it
Albuminuria is an independent risk factor: two patients with the same filtration rate can have very different prognoses depending on their albuminuria. A patient with a GFR of 50 (G3a) and albuminuria of 400 mg/g (A3) is at high risk despite an only moderately reduced GFR.
CKD is defined by an abnormality (an estimated GFR below 60, or kidney damage such as albuminuria) that persists for more than 3 months.
Common mistakes
Classifying CKD by the filtration rate alone and forgetting the albuminuria.
In exam questions
A typical vignette gives a diabetic woman with a GFR of 38 and an albumin-to-creatinine ratio of 150 mg/g, stable for more than 3 months: G3b A2, very high risk on the color map. The practical consequence is to control the factors that slow progression, such as blood pressure and renin-angiotensin blockade. The stage should not be confused with the staging of acute kidney injury.
Keep practicing
This page is the visual summary. To test yourself with real clinical reasoning, Medicinedle, a Wordle-inspired game, gives you one clinical case a day: guess the diagnosis in six tries, with a new clue after every miss. It is free and available in English.