
What the chart shows
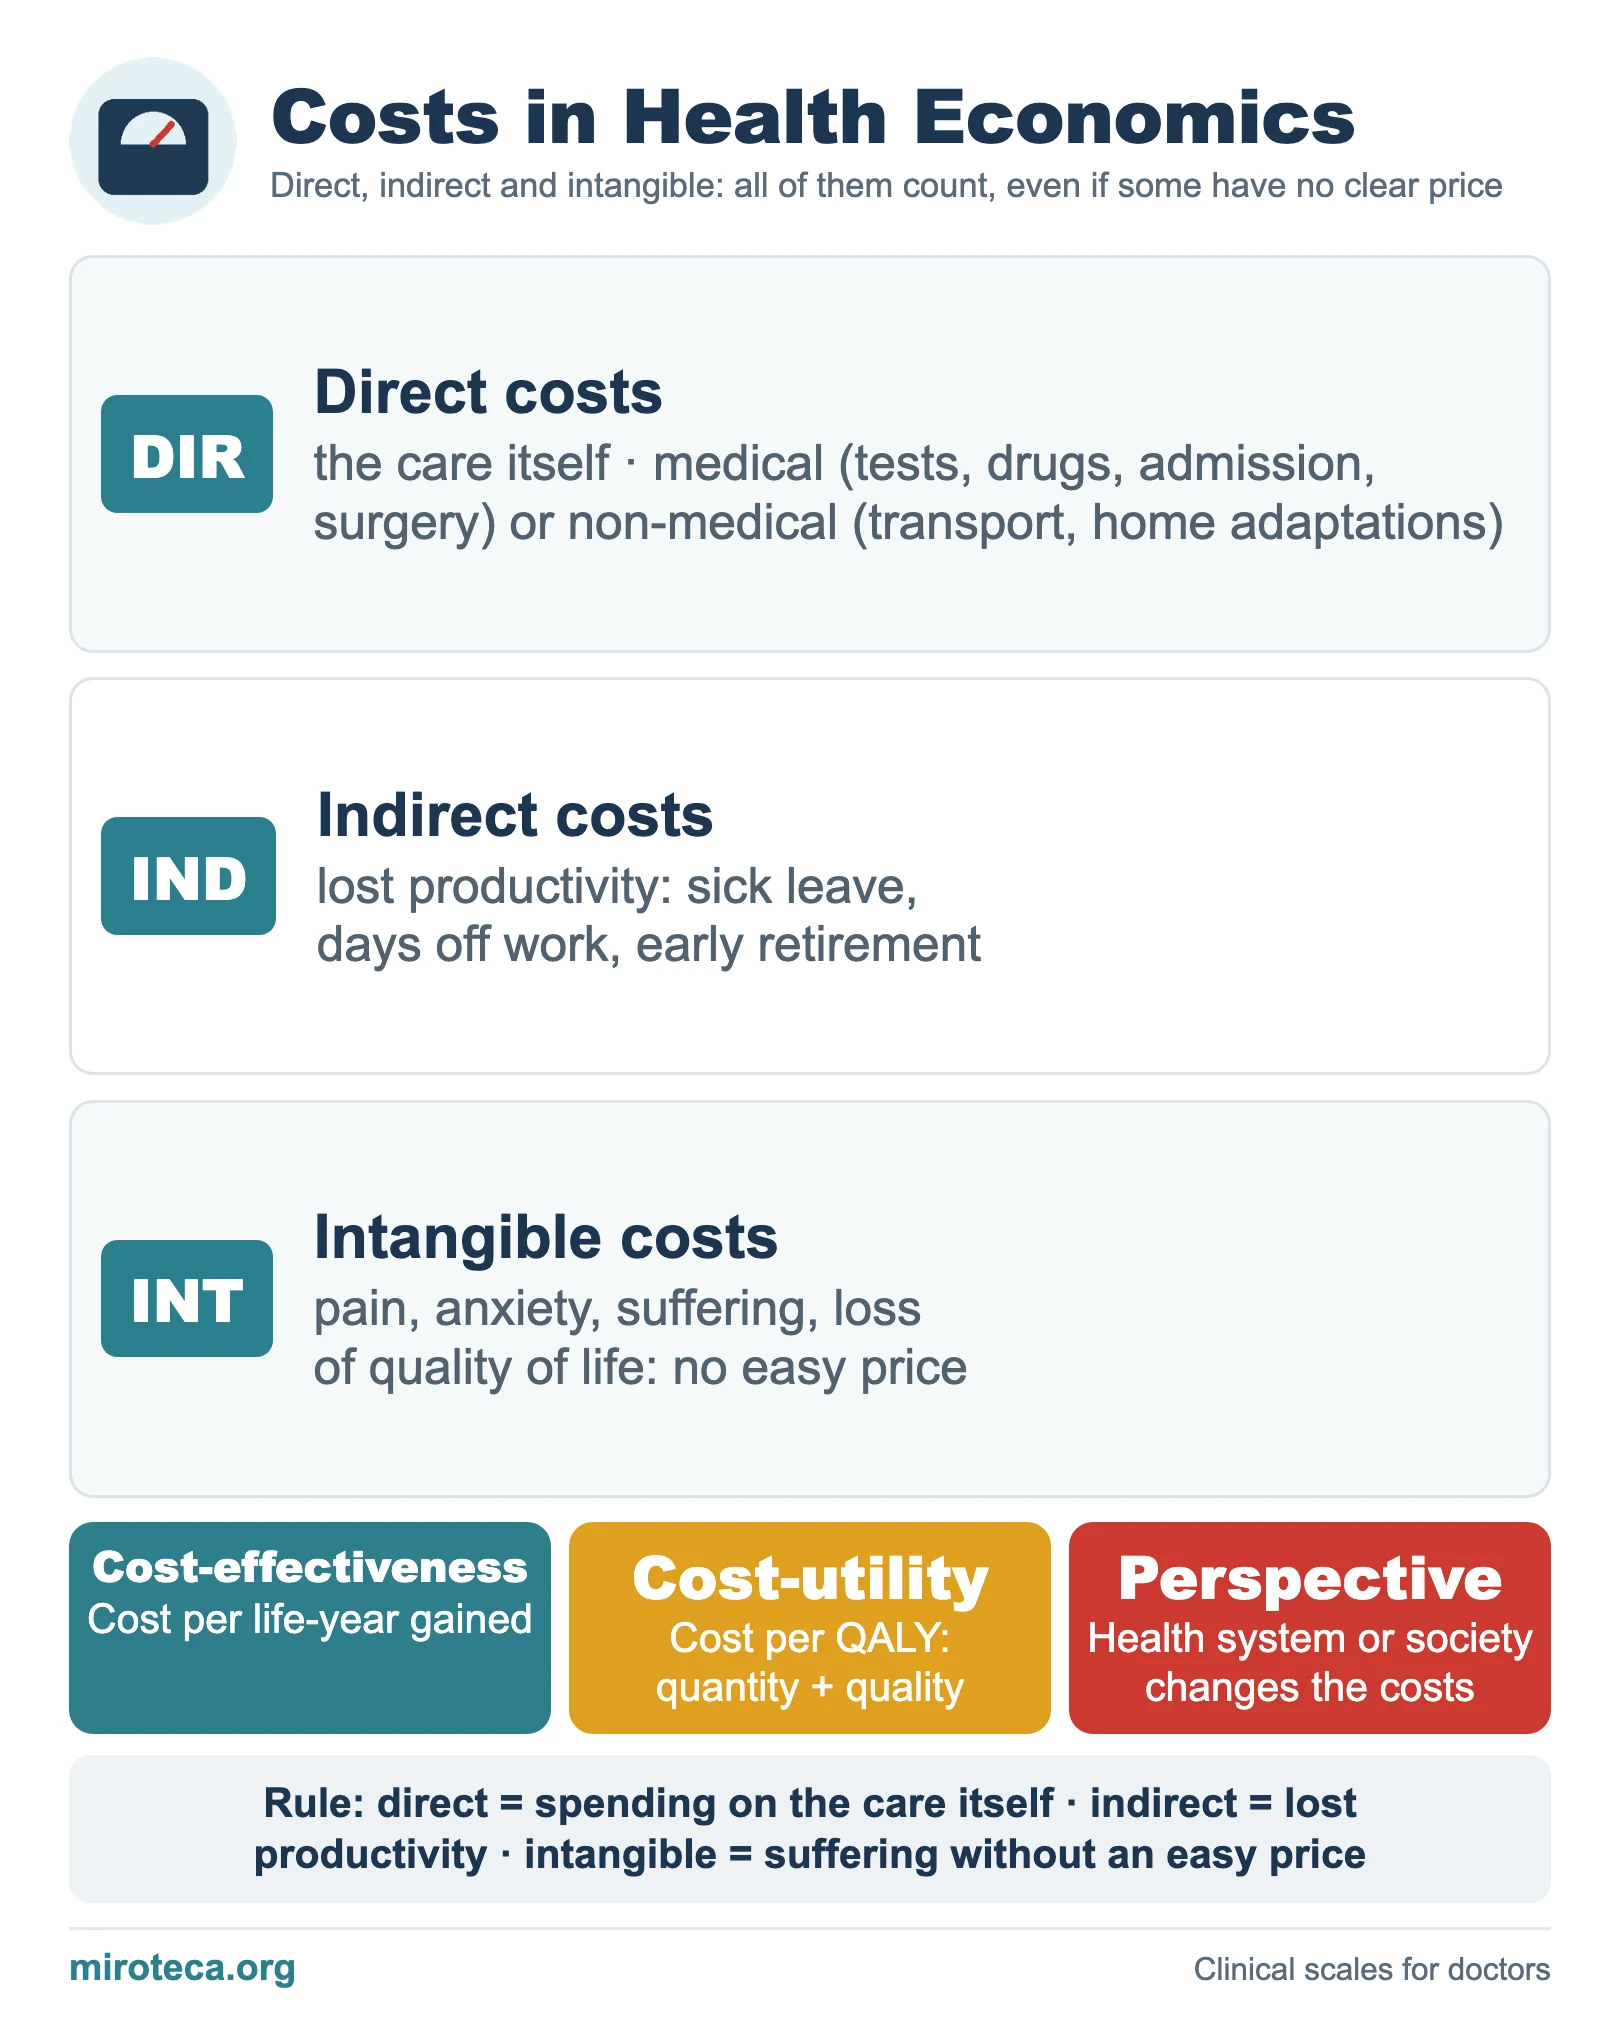
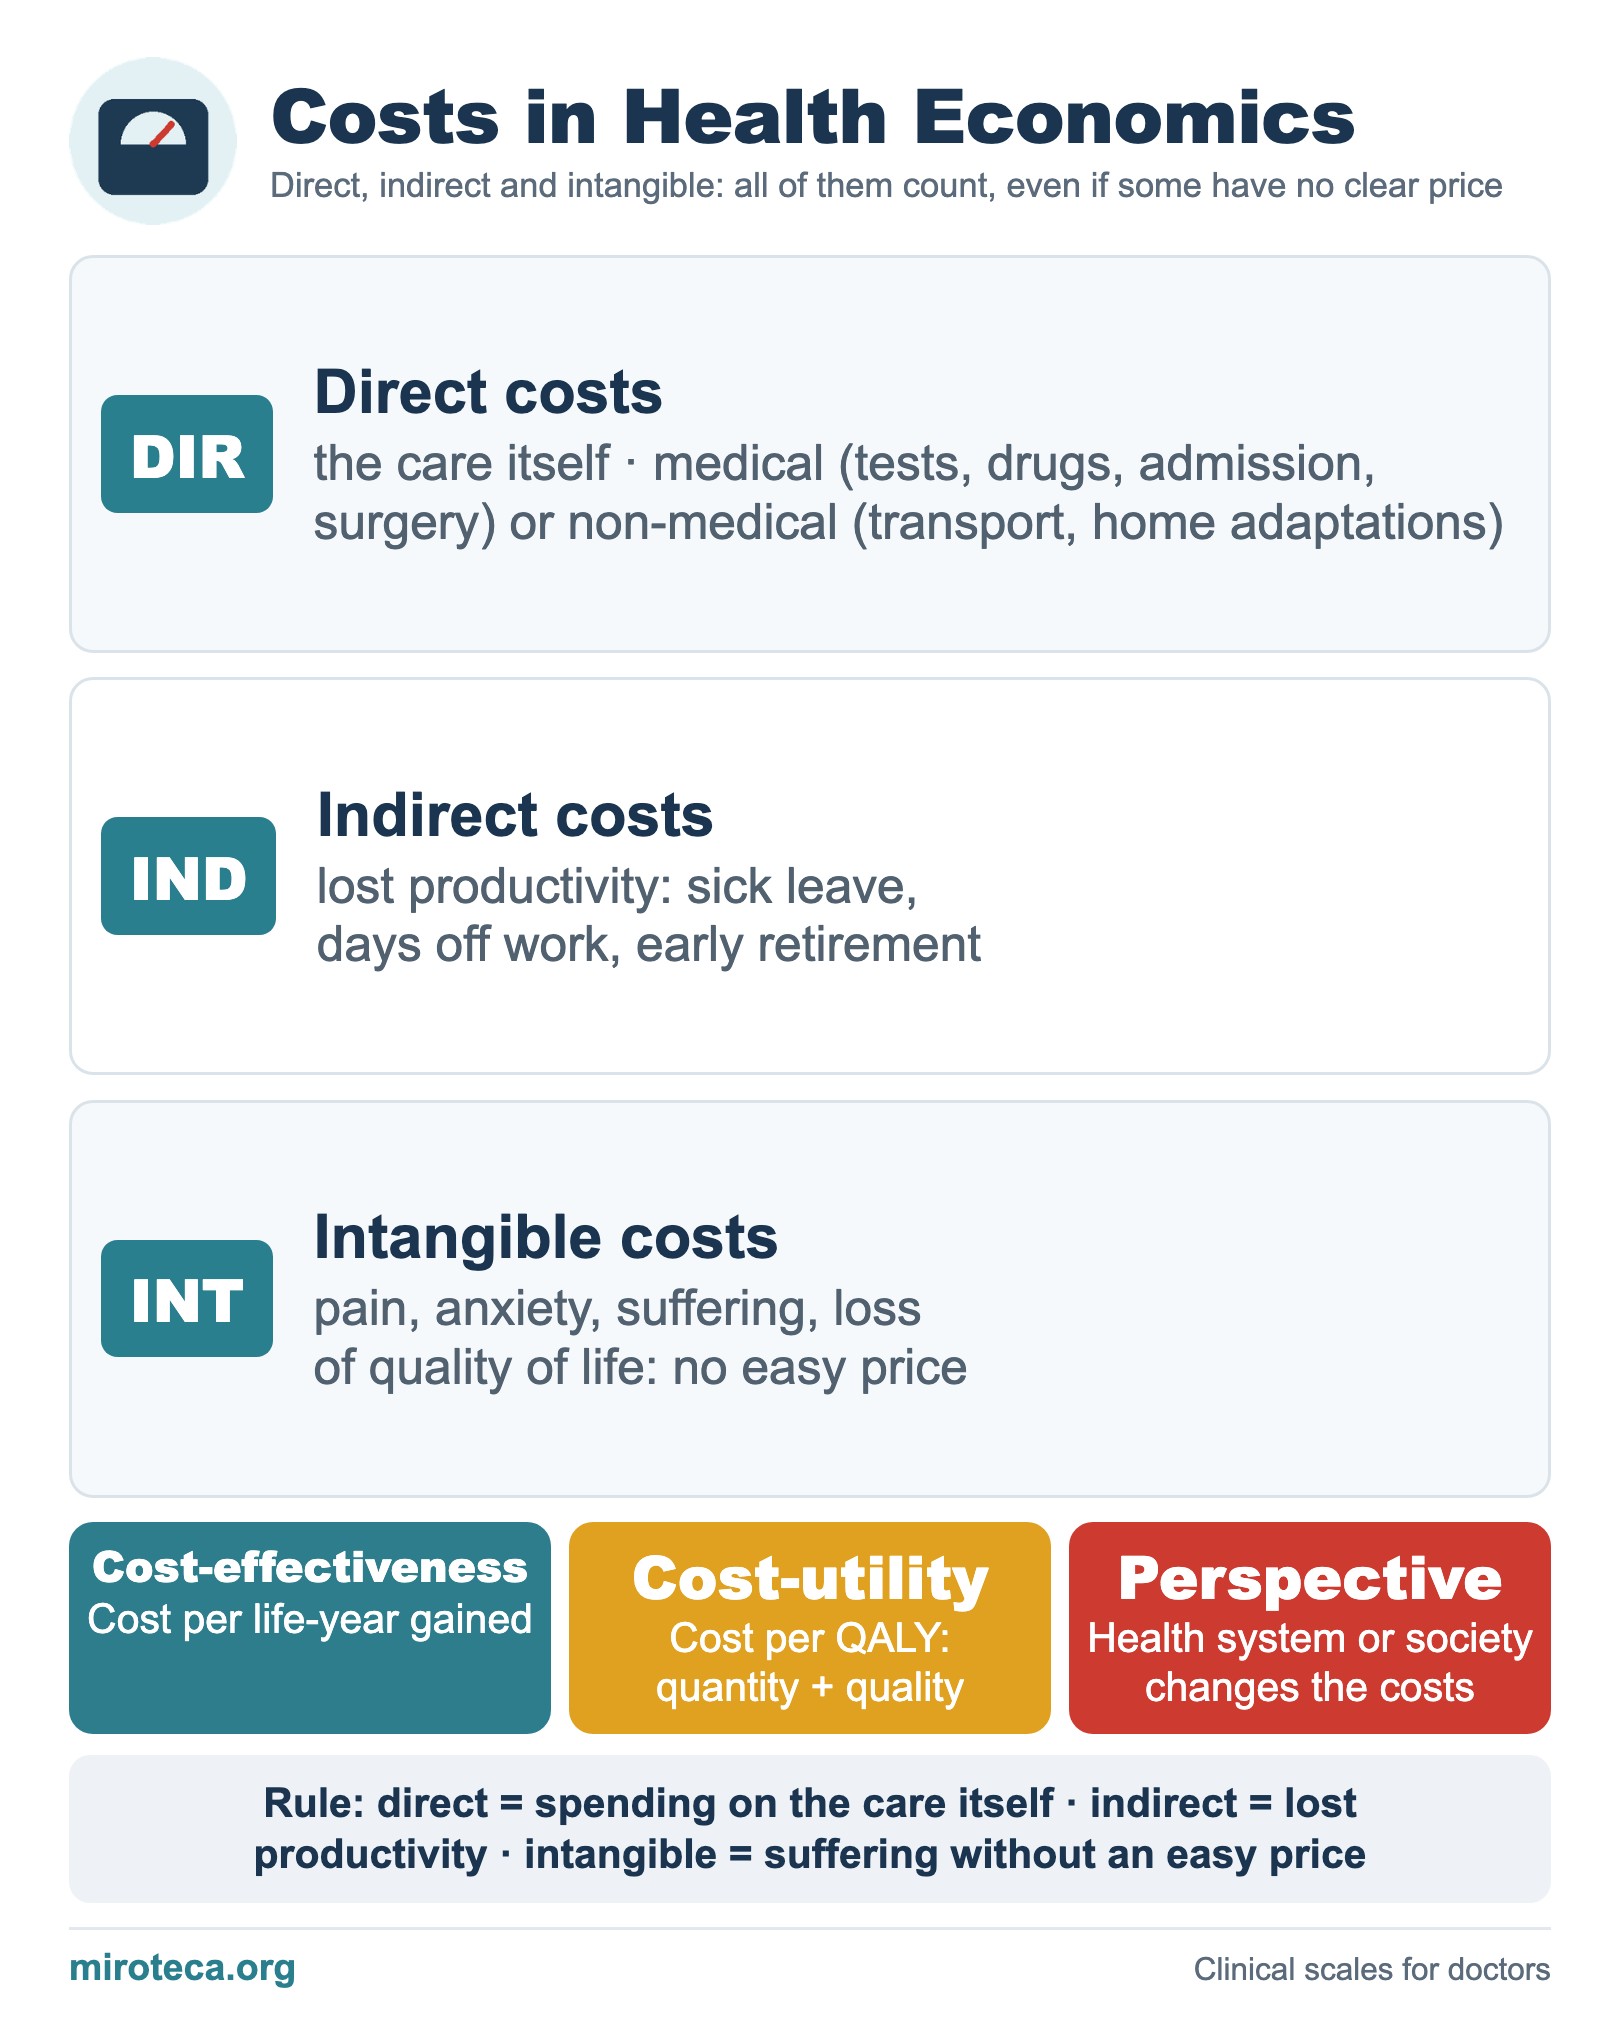
Health economics classifies the costs of a disease so they can be compared in cost-effectiveness studies, and questions ask to place an example in its category.
Examples that clear up doubts
Direct medical: tests, drugs, admission, operating room. Direct non-medical: transport of the patient to hospital, home adaptations. Indirect: sick leave, lost productivity, early retirement. Intangible: pain, anxiety, loss of quality of life.
This classification is the basis of cost-effectiveness analysis (cost per life-year gained) and cost-utility analysis (cost per QALY, which combines quantity and quality of life). The perspective of the study (health system or society) changes which costs are included. See also type I vs type II error.
In exam questions
Short rules: direct means spending on care; indirect means lost productivity; intangible (pain, anxiety) has no easy price but also counts.
Keep practicing
This page is the visual summary. To test yourself with real clinical reasoning, Medicinedle, a Wordle-inspired game, gives you one clinical case a day: guess the diagnosis in six tries, with a new clue after every miss. It is free.
Prefer quick questions? The clinical scores quiz gives you 5 case-based questions in about a minute, with the answer explained.